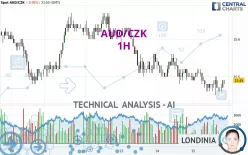
AUD/CZK - 1H - Technical analysis published on 11/15/2024 (GMT)
- 121
- 0
Click here for a new analysis!
- Timeframe : 1H
- - Analysis generated on
- Status : LEVEL MAINTAINED

Summary of the analysis

Additional analysis
Quotes
The AUD/CZK rating is 15.49 CZK. The price registered a decrease of -0.07% on the session with the lowest point at 15.45 CZK and the highest point at 15.52 CZK. The deviation from the price is +0.26% for the low point and -0.19% for the high point.So that you have an overall view of the price change, here is a table showing the variations over several periods:
Near a new HIGH record (1 year)
Type : Bullish
Timeframe : Weekly
Near a new LOW record (1st january)
Type : Bearish
Timeframe : Weekly
Near a new LOW record (1 month)
Type : Bearish
Timeframe : Weekly
Technical
Technical analysis of AUD/CZK in 1H shows an overall bearish trend. 75.00% of the signals given by moving averages are bearish. Caution: the neutral signals currently given by short-term moving averages show us that the global trend is losing momentum. The Central Indicators scanner detects a bullish signal on moving averages that could impact this trend:
Bullish trend reversal : adaptative moving average 20
Type : Bullish
Timeframe : 1 hour
The probability of a further increase are moderate given the direction of the technical indicators.
Caution: the Central Indicators scanner currently detects an excess:
Williams %R indicator is overbought : over -20
Type : Neutral
Timeframe : 1 hour
The analysis of the price chart with Central Patterns scanners does not return any result.
There is also a Japanese candlestick pattern detected by Central Candlesticks that could mark the end of the current short-term trend:
Doji
Type : Neutral
Timeframe : 1 hour
| S3 | S2 | S1 | Price | R1 | R2 | R3 | |
|---|---|---|---|---|---|---|---|
| ProTrendLines | 15.36 | 15.39 | 15.44 | 15.49 | 15.52 | 15.56 | 15.61 |
| Change (%) | -0.84% | -0.65% | -0.32% | - | +0.19% | +0.45% | +0.77% |
| Change | -0.13 | -0.10 | -0.05 | - | +0.03 | +0.07 | +0.12 |
| Level | Intermediate | Minor | Major | - | Major | Minor | Intermediate |
Attention could also be paid to pivot points to set price objectives:
| Pivot points | S3 | S2 | S1 | PP | R1 | R2 | R3 |
|---|---|---|---|---|---|---|---|
| Standard | 15.39 | 15.43 | 15.47 | 15.51 | 15.55 | 15.59 | 15.63 |
| Camarilla | 15.48 | 15.49 | 15.49 | 15.50 | 15.51 | 15.52 | 15.52 |
| Woodie | 15.38 | 15.43 | 15.46 | 15.51 | 15.54 | 15.59 | 15.62 |
| Fibonacci | 15.43 | 15.46 | 15.48 | 15.51 | 15.54 | 15.56 | 15.59 |
| Pivot points | S3 | S2 | S1 | PP | R1 | R2 | R3 |
|---|---|---|---|---|---|---|---|
| Standard | 14.98 | 15.14 | 15.32 | 15.48 | 15.66 | 15.82 | 16.00 |
| Camarilla | 15.42 | 15.45 | 15.48 | 15.51 | 15.54 | 15.57 | 15.60 |
| Woodie | 15.00 | 15.15 | 15.34 | 15.49 | 15.68 | 15.83 | 16.02 |
| Fibonacci | 15.14 | 15.27 | 15.35 | 15.48 | 15.61 | 15.69 | 15.82 |
| Pivot points | S3 | S2 | S1 | PP | R1 | R2 | R3 |
|---|---|---|---|---|---|---|---|
| Standard | 14.51 | 14.87 | 15.09 | 15.45 | 15.67 | 16.03 | 16.25 |
| Camarilla | 15.14 | 15.19 | 15.25 | 15.30 | 15.35 | 15.41 | 15.46 |
| Woodie | 14.43 | 14.84 | 15.01 | 15.42 | 15.59 | 16.00 | 16.17 |
| Fibonacci | 14.87 | 15.10 | 15.23 | 15.45 | 15.68 | 15.81 | 16.03 |
Numerical data
The following are the details of the technical indicators and moving averages that were collected to generate this technical analysis:
| RSI (14): | 49.70 | |
| MACD (12,26,9): | -0.0100 | |
| Directional Movement: | -9.98 | |
| AROON (14): | -57.14 | |
| DEMA (21): | 15.47 | |
| Parabolic SAR (0,02-0,02-0,2): | 15.45 | |
| Elder Ray (13): | 0.01 | |
| Super Trend (3,10): | 15.52 | |
| Zig ZAG (10): | 15.49 | |
| VORTEX (21): | 0.9700 | |
| Stochastique (14,3,5): | 64.44 | |
| TEMA (21): | 15.48 | |
| Williams %R (14): | -20.00 | |
| Chande Momentum Oscillator (20): | 0.01 | |
| Repulse (5,40,3): | 0.1700 | |
| ROCnROLL: | -1 | |
| TRIX (15,9): | -0.0100 | |
| Courbe Coppock: | 0.20 |
| MA7: | 15.56 | |
| MA20: | 15.48 | |
| MA50: | 15.47 | |
| MA100: | 15.42 | |
| MAexp7: | 15.48 | |
| MAexp20: | 15.49 | |
| MAexp50: | 15.51 | |
| MAexp100: | 15.52 | |
| Price / MA7: | -0.45% | |
| Price / MA20: | +0.06% | |
| Price / MA50: | +0.13% | |
| Price / MA100: | +0.45% | |
| Price / MAexp7: | +0.06% | |
| Price / MAexp20: | -0% | |
| Price / MAexp50: | -0.13% | |
| Price / MAexp100: | -0.19% |
About author
Online


Add a comment
Comments
0 comments on the analysis AUD/CZK - 1H