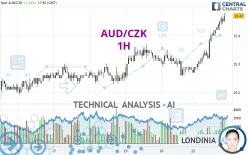
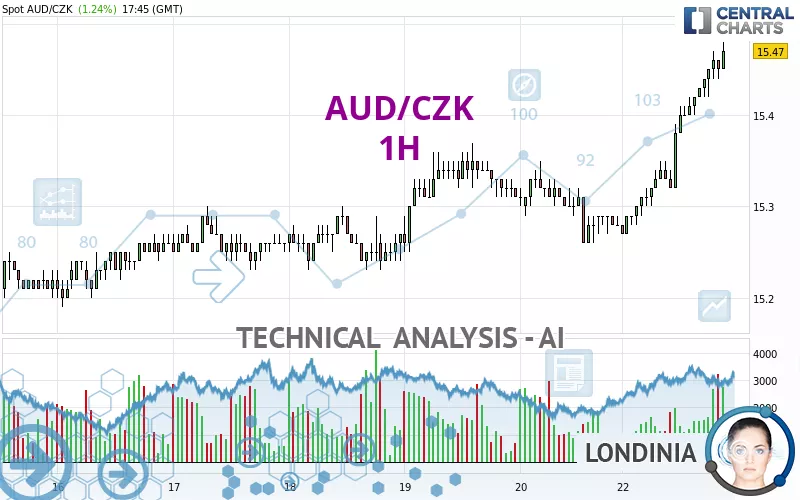
AUD/CZK - 1H - Technical analysis published on 09/23/2024 (GMT)
- 122
- 0
Click here for a new analysis!
- Timeframe : 1H
- - Analysis generated on
- Status : INVALID
Summary of the analysis

Additional analysis
Quotes
The AUD/CZK price is 15.47 CZK. The price registered an increase of +1.24% on the session and was between 15.27 CZK and 15.48 CZK. This implies that the price is at +1.31% from its lowest and at -0.06% from its highest.So that you have an overall view of the price change, here is a table showing the variations over several periods:
Near a new LOW record (1 year)
Type : Bearish
Timeframe : Weekly
Near a new LOW record (1st january)
Type : Bearish
Timeframe : Weekly
New HIGH record (1 month)
Type : Bullish
Timeframe : Weekly
Technical
Technical analysis of AUD/CZK in 1H shows a strongly overall bullish trend. 92.86% of the signals given by moving averages are bullish. The overall trend is supported by the strong bullish signals from short-term moving averages. There is no crossing of moving average by the price or crossing of moving averages between themselves.
Technical indicators are strongly bullish, suggesting that the price increase should continue.
Caution: the Central Indicators scanner currently detects an excess:
RSI indicator is overbought : over 80
Type : Neutral
Timeframe : 1 hour
CCI indicator is overbought : over 100
Type : Neutral
Timeframe : 1 hour
Williams %R indicator is overbought : over -20
Type : Neutral
Timeframe : 1 hour
Pivot points : price is over resistance 2
Type : Neutral
Timeframe : Weekly
Pivot points : price is over resistance 3
Type : Neutral
Timeframe : 1 hour
Central Patterns, the market scanner focusing on chart patterns, resistances and supports found this result:
Resistance of channel is broken
Type : Bullish
Timeframe : 1 hour
The Central Candlesticks scanner, specialised in Japanese candlesticks, did not identify any signals.
| S3 | S2 | S1 | Price | R1 | R2 | R3 | |
|---|---|---|---|---|---|---|---|
| ProTrendLines | 15.30 | 15.36 | 15.44 | 15.47 | 15.52 | 15.82 | 16.69 |
| Change (%) | -1.10% | -0.71% | -0.19% | - | +0.32% | +2.26% | +7.89% |
| Change | -0.17 | -0.11 | -0.03 | - | +0.05 | +0.35 | +1.22 |
| Level | Intermediate | Intermediate | Minor | - | Minor | Major | Major |
Attention could also be paid to pivot points to set price objectives:
| Pivot points | S3 | S2 | S1 | PP | R1 | R2 | R3 |
|---|---|---|---|---|---|---|---|
| Standard | 15.15 | 15.21 | 15.24 | 15.30 | 15.33 | 15.39 | 15.42 |
| Camarilla | 15.26 | 15.26 | 15.27 | 15.28 | 15.29 | 15.30 | 15.31 |
| Woodie | 15.15 | 15.20 | 15.24 | 15.29 | 15.33 | 15.38 | 15.42 |
| Fibonacci | 15.21 | 15.24 | 15.26 | 15.30 | 15.33 | 15.35 | 15.39 |
| Pivot points | S3 | S2 | S1 | PP | R1 | R2 | R3 |
|---|---|---|---|---|---|---|---|
| Standard | 15.01 | 15.10 | 15.19 | 15.28 | 15.37 | 15.46 | 15.55 |
| Camarilla | 15.23 | 15.25 | 15.26 | 15.28 | 15.30 | 15.31 | 15.33 |
| Woodie | 15.01 | 15.10 | 15.19 | 15.28 | 15.37 | 15.46 | 15.55 |
| Fibonacci | 15.10 | 15.17 | 15.21 | 15.28 | 15.35 | 15.39 | 15.46 |
| Pivot points | S3 | S2 | S1 | PP | R1 | R2 | R3 |
|---|---|---|---|---|---|---|---|
| Standard | 14.25 | 14.51 | 14.92 | 15.18 | 15.59 | 15.85 | 16.26 |
| Camarilla | 15.15 | 15.21 | 15.27 | 15.33 | 15.39 | 15.45 | 15.51 |
| Woodie | 14.33 | 14.55 | 15.00 | 15.22 | 15.67 | 15.89 | 16.34 |
| Fibonacci | 14.51 | 14.77 | 14.92 | 15.18 | 15.44 | 15.59 | 15.85 |
Numerical data
The following is the status of the technical indicators and moving averages at the time of publication of this technical analysis:
| RSI (14): | 80.11 | |
| MACD (12,26,9): | 0.0400 | |
| Directional Movement: | 32.03 | |
| AROON (14): | 85.71 | |
| DEMA (21): | 15.44 | |
| Parabolic SAR (0,02-0,02-0,2): | 15.41 | |
| Elder Ray (13): | 0.05 | |
| Super Trend (3,10): | 15.39 | |
| Zig ZAG (10): | 15.47 | |
| VORTEX (21): | 1.3700 | |
| Stochastique (14,3,5): | 93.59 | |
| TEMA (21): | 15.47 | |
| Williams %R (14): | -6.25 | |
| Chande Momentum Oscillator (20): | 0.14 | |
| Repulse (5,40,3): | 0.2500 | |
| ROCnROLL: | 1 | |
| TRIX (15,9): | 0.0300 | |
| Courbe Coppock: | 1.71 |
| MA7: | 15.29 | |
| MA20: | 15.25 | |
| MA50: | 15.27 | |
| MA100: | 15.31 | |
| MAexp7: | 15.44 | |
| MAexp20: | 15.39 | |
| MAexp50: | 15.35 | |
| MAexp100: | 15.32 | |
| Price / MA7: | +1.18% | |
| Price / MA20: | +1.44% | |
| Price / MA50: | +1.31% | |
| Price / MA100: | +1.05% | |
| Price / MAexp7: | +0.19% | |
| Price / MAexp20: | +0.52% | |
| Price / MAexp50: | +0.78% | |
| Price / MAexp100: | +0.98% |
About author
Online


Add a comment
Comments
0 comments on the analysis AUD/CZK - 1H