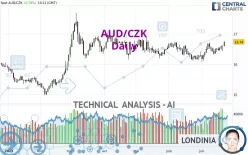
AUD/CZK - Daily - Technical analysis published on 07/22/2022 (GMT)
- 145
- 0
Click here for a new analysis!
- Timeframe : Daily
- - Analysis generated on
- Status : LEVEL MAINTAINED

Summary of the analysis

Additional analysis
Quotes
AUD/CZK rating 16.74 CZK. On the day, this instrument gained +0.78% and was traded between 16.59 CZK and 16.76 CZK over the period. The price is currently at +0.90% from its lowest and -0.12% from its highest.So that you have an overall view of the price change, here is a table showing the variations over several periods:
New HIGH record (1 month)
Type : Bullish
Timeframe : Weekly
Technical
A technical analysis in Daily of this AUD/CZK chart shows a bullish trend. The signals returned by the moving averages are 71.43% bullish. This bullish trend is reinforced by the strong signals currently being given by short-term moving averages. There is no crossing of moving average by the price or crossing of moving averages between themselves.
In fact, according to the parameters integrated into the Central Analyzer system, 14 technical indicators out of 18 analysed are currently bullish. Caution: the Central Indicators scanner currently detects an excess:
CCI indicator is overbought : over 100
Type : Neutral
Timeframe : Daily
Williams %R indicator is overbought : over -20
Type : Neutral
Timeframe : Daily
Pivot points : price is over resistance 1
Type : Neutral
Timeframe : Daily
Pivot points : price is over resistance 1
Type : Neutral
Timeframe : Weekly
SuperTrend indicator bullish reversal
Type : Bullish
Timeframe : Daily
The Central Patterns scanner, which studies chart patterns, resistances and supports, has identified these signals:
Near horizontal resistance
Type : Bearish
Timeframe : Daily
Resistance of channel is broken
Type : Bullish
Timeframe : Daily
Resistance of triangle is broken
Type : Bullish
Timeframe : Daily
No result was found by the Central Candlesticks scanner on Japanese candlesticks.
| S3 | S2 | S1 | Price | R1 | R2 | R3 | |
|---|---|---|---|---|---|---|---|
| ProTrendLines | 15.90 | 16.36 | 16.69 | 16.74 | 17.06 | 17.39 | 18.16 |
| Change (%) | -5.02% | -2.27% | -0.30% | - | +1.91% | +3.88% | +8.48% |
| Change | -0.84 | -0.38 | -0.05 | - | +0.32 | +0.65 | +1.42 |
| Level | Minor | Major | Major | - | Intermediate | Intermediate | Minor |
Attention could also be paid to pivot points to set price objectives:
| Pivot points | S3 | S2 | S1 | PP | R1 | R2 | R3 |
|---|---|---|---|---|---|---|---|
| Standard | 16.28 | 16.36 | 16.48 | 16.56 | 16.68 | 16.76 | 16.88 |
| Camarilla | 16.56 | 16.57 | 16.59 | 16.61 | 16.63 | 16.65 | 16.67 |
| Woodie | 16.31 | 16.37 | 16.51 | 16.57 | 16.71 | 16.77 | 16.91 |
| Fibonacci | 16.36 | 16.43 | 16.48 | 16.56 | 16.63 | 16.68 | 16.76 |
| Pivot points | S3 | S2 | S1 | PP | R1 | R2 | R3 |
|---|---|---|---|---|---|---|---|
| Standard | 16.07 | 16.20 | 16.35 | 16.48 | 16.63 | 16.76 | 16.91 |
| Camarilla | 16.43 | 16.46 | 16.48 | 16.51 | 16.54 | 16.56 | 16.59 |
| Woodie | 16.09 | 16.21 | 16.37 | 16.49 | 16.65 | 16.77 | 16.93 |
| Fibonacci | 16.20 | 16.30 | 16.37 | 16.48 | 16.58 | 16.65 | 16.76 |
| Pivot points | S3 | S2 | S1 | PP | R1 | R2 | R3 |
|---|---|---|---|---|---|---|---|
| Standard | 15.41 | 15.76 | 16.03 | 16.38 | 16.65 | 17.00 | 17.27 |
| Camarilla | 16.12 | 16.18 | 16.23 | 16.29 | 16.35 | 16.40 | 16.46 |
| Woodie | 15.36 | 15.74 | 15.98 | 16.36 | 16.60 | 16.98 | 17.22 |
| Fibonacci | 15.76 | 16.00 | 16.15 | 16.38 | 16.62 | 16.77 | 17.00 |
Numerical data
The following are the details of the technical indicators and moving averages that were collected to generate this technical analysis:
| RSI (14): | 61.96 | |
| MACD (12,26,9): | 0.0500 | |
| Directional Movement: | 7.07 | |
| AROON (14): | 100.00 | |
| DEMA (21): | 16.55 | |
| Parabolic SAR (0,02-0,02-0,2): | 16.39 | |
| Elder Ray (13): | 0.15 | |
| Super Trend (3,10): | 16.17 | |
| Zig ZAG (10): | 16.74 | |
| VORTEX (21): | 1.1300 | |
| Stochastique (14,3,5): | 85.85 | |
| TEMA (21): | 16.62 | |
| Williams %R (14): | -5.66 | |
| Chande Momentum Oscillator (20): | 0.24 | |
| Repulse (5,40,3): | 1.7700 | |
| ROCnROLL: | 1 | |
| TRIX (15,9): | 0.0200 | |
| Courbe Coppock: | 2.99 |
| MA7: | 16.56 | |
| MA20: | 16.44 | |
| MA50: | 16.45 | |
| MA100: | 16.55 | |
| MAexp7: | 16.58 | |
| MAexp20: | 16.49 | |
| MAexp50: | 16.47 | |
| MAexp100: | 16.41 | |
| Price / MA7: | +1.09% | |
| Price / MA20: | +1.82% | |
| Price / MA50: | +1.76% | |
| Price / MA100: | +1.15% | |
| Price / MAexp7: | +0.97% | |
| Price / MAexp20: | +1.52% | |
| Price / MAexp50: | +1.64% | |
| Price / MAexp100: | +2.01% |
About author
Online


Add a comment
Comments
0 comments on the analysis AUD/CZK - Daily