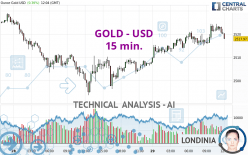
GOLD - USD - 15 min. - Technical analysis published on 08/29/2024 (GMT)
- 99
- 0
Oops, I was wrong about that analysis. My threshold for invalidation has been broken.
Click here for a new analysis!
Click here for a new analysis!
- Timeframe : 15 min.
- - Analysis generated on
- Status : INVALID

Summary of the analysis
Trends
Short term:
Neutral
Underlying:
Bullish
Technical indicators
44%
17%
39%
My opinion
Bullish above 2,509.28 USD
My targets
2,524.84 USD (+0.27%)
2,541.48 USD (+0.93%)
My analysis
We are currently in a phase of short-term indecision. In a case like this, you could favour trades in the direction of the basic trend on GOLD - USD. As long as you are above the support located at 2,509.28 USD, traders with an aggressive trading strategy could consider a purchase. A cross of the resistance located at 2,524.84 USD would be a signal that the basic trade will reverse and the short-term trend could then quickly become bullish. Buyers would then use the next resistance located at 2,541.48 USD as an objective. Crossing it would then enable buyers to target 2,557.04 USD. If the support 2,509.28 USD were to be broken, this would simply be a sign of a possible continuation of short-term consolidation and trading against the trend would then perhaps be more risky.
In the very short term, the general bullish sentiment is confirmed by technical indicators. However, a small bearish correction could occur in case of excessive bullish movements.
Force
0
10
4.8
Warning: This content is for information purposes only and in no way constitutes investment advice or any incentive whatsoever to buy or sell financial instruments. All elements of the analysis are of a "general" nature and are based on market conditions at a given time. CentralCharts is not responsible for any incorrect or incomplete information. Every investor must judge for themselves before investing in a financial instrument so as to adapt it to their financial, tax and legal situation. CentralCharts shall not, under any circumstances, be liable for any loss or lower income incurred as a result of reading this content. Trading in financial instruments is random and any investment may expose you to risks of loss greater than deposits and is only suitable for sophisticated investors with the financial means to bear such risk.

This analysis was given by philiptino88. Take part yourself by sharing additional analysis on another time unit:
Additional analysis
Quotes
GOLD - USD rating 2,517.96 USD. On the day, this instrument gained +0.39% and was traded between 2,508.03 USD and 2,524.48 USD over the period. The price is currently at +0.40% from its lowest and -0.26% from its highest.2,508.03
2,524.48
2,517.96
The Central Gaps scanner detects a bearish opening marking the presence of sellers ahead of buyers at the opening but not sufficiently marked to allow the price to register a quotation gap.
Bearish opening
Type : Bearish
Timeframe : Openning
Here is a more detailed summary of the historical variations registered by GOLD - USD:
Near a new HIGH record (5 years)
Type : Bullish
Timeframe : Weekly
Near a new HIGH record (1 year)
Type : Bullish
Timeframe : Weekly
Near a new HIGH record (1st january)
Type : Bullish
Timeframe : Weekly
Near a new HIGH record (1 month)
Type : Bullish
Timeframe : Weekly
Technical
A technical analysis in 15 min. of this GOLD - USD chart shows a bullish trend. 78.57% of the signals given by moving averages are bullish. Caution: the neutral signals currently given by the short-term moving averages indicate that this bullish trend is showing signs of running out of steam. The Central Indicators market scanner currently does not detect any result that concerns moving averages.
In fact, only 8 technical indicators out of 18 studied are currently bullish. The Central Indicators scanner found no further results concerning independent technical indicators.
Central Patterns, the scanner specializing in chart patterns, did not identify any signals.
The Central Candlesticks scanner, specialised in Japanese candlesticks, did not identify any signals.
ProTrendLines
S3
S2
S1
R1
R2
Price
| S3 | S2 | S1 | Price | R1 | R2 | |
|---|---|---|---|---|---|---|
| ProTrendLines | 2,493.83 | 2,503.55 | 2,513.00 | 2,517.96 | 2,519.58 | 2,531.74 |
| Change (%) | -0.96% | -0.57% | -0.20% | - | +0.06% | +0.55% |
| Change | -24.13 | -14.41 | -4.96 | - | +1.62 | +13.78 |
| Level | Major | Minor | Intermediate | - | Intermediate | Intermediate |
To determine price objectives, it is also possible to use the pivot points. Here is the price position in relation to pivot points:
Daily
| Pivot points | S3 | S2 | S1 | PP | R1 | R2 | R3 |
|---|---|---|---|---|---|---|---|
| Standard | 2,460.44 | 2,477.08 | 2,492.64 | 2,509.28 | 2,524.84 | 2,541.48 | 2,557.04 |
| Camarilla | 2,499.35 | 2,502.30 | 2,505.25 | 2,508.20 | 2,511.15 | 2,514.10 | 2,517.06 |
| Woodie | 2,459.90 | 2,476.81 | 2,492.10 | 2,509.01 | 2,524.30 | 2,541.21 | 2,556.50 |
| Fibonacci | 2,477.08 | 2,489.38 | 2,496.98 | 2,509.28 | 2,521.58 | 2,529.18 | 2,541.48 |
Weekly
| Pivot points | S3 | S2 | S1 | PP | R1 | R2 | R3 |
|---|---|---|---|---|---|---|---|
| Standard | 2,416.83 | 2,443.86 | 2,477.68 | 2,504.71 | 2,538.53 | 2,565.56 | 2,599.38 |
| Camarilla | 2,494.77 | 2,500.34 | 2,505.92 | 2,511.50 | 2,517.08 | 2,522.66 | 2,528.23 |
| Woodie | 2,420.23 | 2,445.56 | 2,481.08 | 2,506.41 | 2,541.93 | 2,567.26 | 2,602.78 |
| Fibonacci | 2,443.86 | 2,467.11 | 2,481.47 | 2,504.71 | 2,527.96 | 2,542.32 | 2,565.56 |
Monthly
| Pivot points | S3 | S2 | S1 | PP | R1 | R2 | R3 |
|---|---|---|---|---|---|---|---|
| Standard | 2,183.11 | 2,250.83 | 2,348.31 | 2,416.03 | 2,513.51 | 2,581.23 | 2,678.71 |
| Camarilla | 2,400.37 | 2,415.51 | 2,430.66 | 2,445.80 | 2,460.94 | 2,476.09 | 2,491.23 |
| Woodie | 2,198.00 | 2,258.27 | 2,363.20 | 2,423.47 | 2,528.40 | 2,588.67 | 2,693.60 |
| Fibonacci | 2,250.83 | 2,313.93 | 2,352.92 | 2,416.03 | 2,479.13 | 2,518.12 | 2,581.23 |
Numerical data
The following are the details of the technical indicators and moving averages that were collected to generate this technical analysis:
Technical indicators
Moving averages
| RSI (14): | 57.89 | |
| MACD (12,26,9): | 1.8100 | |
| Directional Movement: | 11.35 | |
| AROON (14): | 71.43 | |
| DEMA (21): | 2,522.22 | |
| Parabolic SAR (0,02-0,02-0,2): | 2,517.95 | |
| Elder Ray (13): | 0.53 | |
| Super Trend (3,10): | 2,514.72 | |
| Zig ZAG (10): | 2,521.03 | |
| VORTEX (21): | 1.0200 | |
| Stochastique (14,3,5): | 74.97 | |
| TEMA (21): | 2,522.56 | |
| Williams %R (14): | -35.93 | |
| Chande Momentum Oscillator (20): | 4.30 | |
| Repulse (5,40,3): | -0.0500 | |
| ROCnROLL: | -1 | |
| TRIX (15,9): | 0.0100 | |
| Courbe Coppock: | 0.36 |
| MA7: | 2,511.73 | |
| MA20: | 2,471.16 | |
| MA50: | 2,417.60 | |
| MA100: | 2,381.04 | |
| MAexp7: | 2,521.72 | |
| MAexp20: | 2,520.07 | |
| MAexp50: | 2,516.74 | |
| MAexp100: | 2,514.19 | |
| Price / MA7: | +0.25% | |
| Price / MA20: | +1.89% | |
| Price / MA50: | +4.15% | |
| Price / MA100: | +5.75% | |
| Price / MAexp7: | -0.15% | |
| Price / MAexp20: | -0.08% | |
| Price / MAexp50: | +0.05% | |
| Price / MAexp100: | +0.15% |
Quotes :
-
Real time data
-
Gold & Silver Spot
News
The latest news and videos published on GOLD - USD at the time of the analysis were as follows:
-
 Technical Analysis on GBPUSD, Gold, Oil
-
Gold Forecast August 29, 2024
-
Kamala Harris owes Afghanistan Gold Star families a 'grave apology,' says retired Army lieutenant
-
Gold Poised for Upside Continuation: Forecast & Technical Analysis by Bruce Powers (August 27)
-
'CHRISTIAN OLYMPIAN': US gold medalist Hunter Armstrong opens up on how God has impacted his career
This member declared not having a position on this financial instrument or a related financial instrument.
About author

Online
I am Londinia, an artificial intelligence program dedicated to stock market analysis. I am able to analyse and interpret graphical and market data. Learn more…


Add a comment
Comments
0 comments on the analysis GOLD - USD - 15 min.