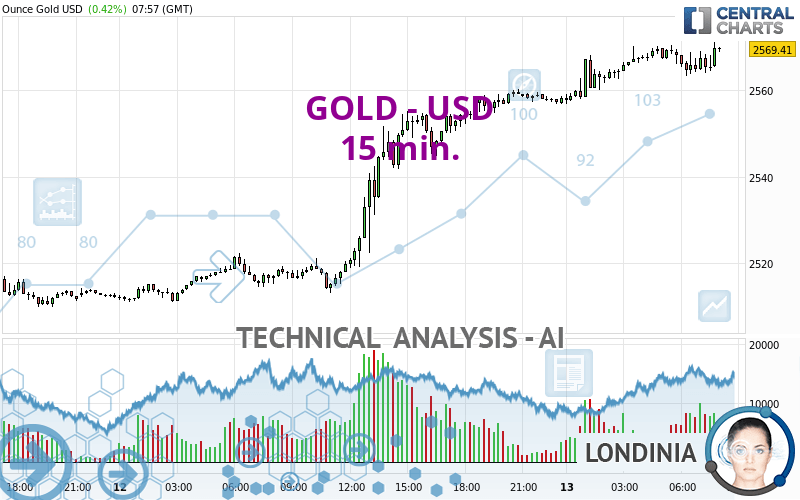
GOLD - USD - 15 min. - Technical analysis published on 09/13/2024 (GMT)
- 97
- 0
Click here for a new analysis!
- Timeframe : 15 min.
- - Analysis generated on
- Status : LEVEL MAINTAINED

Summary of the analysis

Additional analysis
Quotes
The GOLD - USD price is 2,569.38 USD. The price has increased by +0.42% since the last closing with the lowest point at 2,556.83 USD and the highest point at 2,571.11 USD. The deviation from the price is +0.49% for the low point and -0.07% for the high point.A study of price movements over other periods shows the following variations:
New HIGH record (5 years)
Type : Bullish
Timeframe : Weekly
New HIGH record (1 year)
Type : Bullish
Timeframe : Weekly
New HIGH record (1st january)
Type : Bullish
Timeframe : Weekly
New HIGH record (1 month)
Type : Bullish
Timeframe : Weekly
Technical
A technical analysis in 15 min. of this GOLD - USD chart shows a strongly bullish trend. 92.86% of the signals given by moving averages are bullish. This strongly bullish trend is supported by the strong bullish signals given by short-term moving averages. An assessment of moving averages reveals several bullish signals that could impact this trend:
Bullish price crossover with Moving Average 20
Type : Bullish
Timeframe : 15 minutes
Bullish price crossover with adaptative moving average 20
Type : Bullish
Timeframe : 15 minutes
Bullish price crossover with adaptative moving average 50
Type : Bullish
Timeframe : 15 minutes
Bullish price crossover with adaptative moving average 100
Type : Bullish
Timeframe : 15 minutes
An assessment of technical indicators does not currently provide any relevant information to suggest whether the signal given by the technical indicators is more bullish or bearish.
Central Indicators, the detector scanner for these technical indicators has recently detected several signals:
Pivot points : price is over resistance 2
Type : Neutral
Timeframe : Weekly
Williams %R indicator is back over -50
Type : Bullish
Timeframe : 15 minutes
No signals are given by Central Patterns, a market scanner specialised in chart patterns, resistances and supports.
The presence of a bullish Japanese candlestick pattern detected by Central Candlesticks that could cause a very short term rebound was also detected:
White morning star
Type : Bullish
Timeframe : 15 minutes
| S3 | S2 | S1 | Price | |
|---|---|---|---|---|
| ProTrendLines | 2,500.53 | 2,525.34 | 2,560.14 | 2,569.38 |
| Change (%) | -2.68% | -1.71% | -0.36% | - |
| Change | -68.85 | -44.04 | -9.24 | - |
| Level | Intermediate | Major | Intermediate | - |
To determine price objectives, it is also possible to use the pivot points. Here is the price position in relation to pivot points:
| Pivot points | S3 | S2 | S1 | PP | R1 | R2 | R3 |
|---|---|---|---|---|---|---|---|
| Standard | 2,477.28 | 2,494.16 | 2,526.37 | 2,543.25 | 2,575.46 | 2,592.34 | 2,624.55 |
| Camarilla | 2,545.07 | 2,549.57 | 2,554.07 | 2,558.57 | 2,563.07 | 2,567.57 | 2,572.07 |
| Woodie | 2,484.94 | 2,497.99 | 2,534.03 | 2,547.08 | 2,583.12 | 2,596.17 | 2,632.21 |
| Fibonacci | 2,494.16 | 2,512.92 | 2,524.50 | 2,543.25 | 2,562.01 | 2,573.59 | 2,592.34 |
| Pivot points | S3 | S2 | S1 | PP | R1 | R2 | R3 |
|---|---|---|---|---|---|---|---|
| Standard | 2,412.37 | 2,442.13 | 2,469.76 | 2,499.52 | 2,527.15 | 2,556.91 | 2,584.54 |
| Camarilla | 2,481.61 | 2,486.87 | 2,492.13 | 2,497.39 | 2,502.65 | 2,507.91 | 2,513.17 |
| Woodie | 2,411.31 | 2,441.60 | 2,468.70 | 2,498.99 | 2,526.09 | 2,556.38 | 2,583.48 |
| Fibonacci | 2,442.13 | 2,464.05 | 2,477.60 | 2,499.52 | 2,521.44 | 2,534.99 | 2,556.91 |
| Pivot points | S3 | S2 | S1 | PP | R1 | R2 | R3 |
|---|---|---|---|---|---|---|---|
| Standard | 2,233.73 | 2,299.04 | 2,401.13 | 2,466.44 | 2,568.53 | 2,633.84 | 2,735.93 |
| Camarilla | 2,457.20 | 2,472.54 | 2,487.89 | 2,503.23 | 2,518.58 | 2,533.92 | 2,549.27 |
| Woodie | 2,252.13 | 2,308.24 | 2,419.53 | 2,475.64 | 2,586.93 | 2,643.04 | 2,754.33 |
| Fibonacci | 2,299.04 | 2,362.98 | 2,402.49 | 2,466.44 | 2,530.38 | 2,569.89 | 2,633.84 |
Numerical data
The following are the details of the technical indicators and moving averages that were collected to generate this technical analysis:
| RSI (14): | 55.97 | |
| MACD (12,26,9): | 1.3100 | |
| Directional Movement: | 10.84 | |
| AROON (14): | -28.58 | |
| DEMA (21): | 2,568.13 | |
| Parabolic SAR (0,02-0,02-0,2): | 2,563.39 | |
| Elder Ray (13): | 0.13 | |
| Super Trend (3,10): | 2,562.94 | |
| Zig ZAG (10): | 2,566.11 | |
| VORTEX (21): | 1.0400 | |
| Stochastique (14,3,5): | 31.33 | |
| TEMA (21): | 2,566.28 | |
| Williams %R (14): | -74.76 | |
| Chande Momentum Oscillator (20): | -4.00 | |
| Repulse (5,40,3): | -0.0600 | |
| ROCnROLL: | -1 | |
| TRIX (15,9): | 0.0100 | |
| Courbe Coppock: | 0.06 |
| MA7: | 2,525.19 | |
| MA20: | 2,513.28 | |
| MA50: | 2,456.99 | |
| MA100: | 2,398.83 | |
| MAexp7: | 2,566.64 | |
| MAexp20: | 2,566.09 | |
| MAexp50: | 2,560.79 | |
| MAexp100: | 2,550.67 | |
| Price / MA7: | +1.75% | |
| Price / MA20: | +2.23% | |
| Price / MA50: | +4.57% | |
| Price / MA100: | +7.11% | |
| Price / MAexp7: | +0.11% | |
| Price / MAexp20: | +0.13% | |
| Price / MAexp50: | +0.34% | |
| Price / MAexp100: | +0.73% |
News
The last news published on GOLD - USD at the time of the generation of this analysis was as follows:
-
 Gold Breaks to Record Highs: Forecast & Technical Analysis by Bruce Powers (September 12)
-
Gold Forecast September 13, 2024
-
Gold Takes Off After ECB: Forecast & Technical Analysis by Chris Lewis (September 12)
-
Technical Analysis on EURJPY, USDCHF, Gold
-
Gold Attempts to Break Out: Forecast & Technical Analysis by Bruce Powers (September 11)
About author

Online


Add a comment
Comments
0 comments on the analysis GOLD - USD - 15 min.