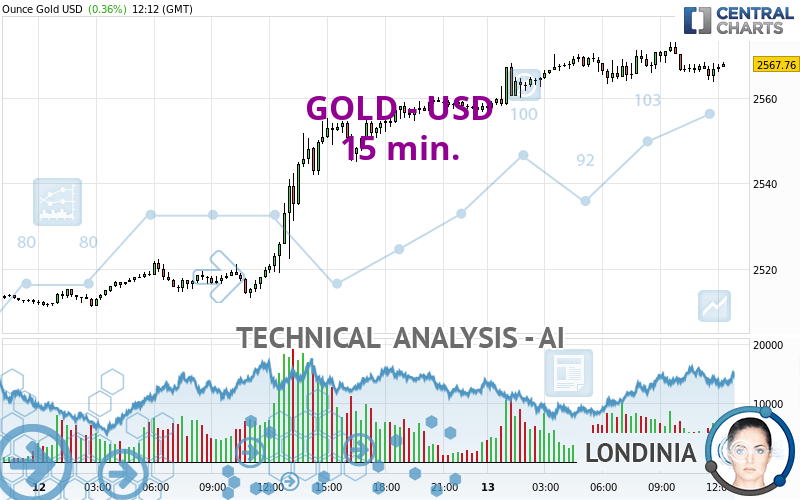
GOLD - USD - 15 min. - Technical analysis published on 09/13/2024 (GMT)
- Who voted?
- 137
- 0
Click here for a new analysis!
- Timeframe : 15 min.
- - Analysis generated on
- Status : TARGET REACHED
Summary of the analysis

Additional analysis
Quotes
The GOLD - USD rating is 2,567.66 USD. The price has increased by +0.36% since the last closing and was traded between 2,556.83 USD and 2,573.00 USD over the period. The price is currently at +0.42% from its lowest and -0.21% from its highest.A study of price movements over other periods shows the following variations:
New HIGH record (5 years)
Type : Bullish
Timeframe : Weekly
New HIGH record (1 year)
Type : Bullish
Timeframe : Weekly
New HIGH record (1st january)
Type : Bullish
Timeframe : Weekly
New HIGH record (1 month)
Type : Bullish
Timeframe : Weekly
Technical
Technical analysis of GOLD - USD in 15 min. shows an overall bullish trend. The signals given by moving averages are 78.57% bullish. This bullish trend could slow down given the neutral signals currently being given by short-term moving averages. The Central Indicators scanner detects bullish and bearish signals on moving averages that could impact this trend:
Bullish trend reversal : Moving Average 20
Type : Bullish
Timeframe : 15 minutes
Bearish price crossover with Moving Average 50
Type : Bearish
Timeframe : 15 minutes
On the 18 technical indicators analysed, 5 are bullish, 7 are neutral and 6 are bearish. Caution: the Central Indicators scanner currently detects an excess:
CCI indicator is oversold : under -100
Type : Neutral
Timeframe : 15 minutes
Williams %R indicator is oversold : under -80
Type : Neutral
Timeframe : 15 minutes
Pivot points : price is over resistance 2
Type : Neutral
Timeframe : Weekly
MACD indicator is back under 0
Type : Bearish
Timeframe : 15 minutes
Momentum indicator is back under 0
Type : Bearish
Timeframe : 15 minutes
No signals are given by Central Patterns, a market scanner specialised in chart patterns, resistances and supports.
The Central Candlesticks scanner currently notes the presence of this pattern in Japanese candlesticks that could mark the end of the short-term trend currently underway:
Doji
Type : Neutral
Timeframe : 15 minutes
| S3 | S2 | S1 | Price | |
|---|---|---|---|---|
| ProTrendLines | 2,500.53 | 2,525.34 | 2,560.14 | 2,567.66 |
| Change (%) | -2.61% | -1.65% | -0.29% | - |
| Change | -67.13 | -42.32 | -7.52 | - |
| Level | Intermediate | Major | Intermediate | - |
Attention could also be paid to pivot points to set price objectives:
| Pivot points | S3 | S2 | S1 | PP | R1 | R2 | R3 |
|---|---|---|---|---|---|---|---|
| Standard | 2,477.28 | 2,494.16 | 2,526.37 | 2,543.25 | 2,575.46 | 2,592.34 | 2,624.55 |
| Camarilla | 2,545.07 | 2,549.57 | 2,554.07 | 2,558.57 | 2,563.07 | 2,567.57 | 2,572.07 |
| Woodie | 2,484.94 | 2,497.99 | 2,534.03 | 2,547.08 | 2,583.12 | 2,596.17 | 2,632.21 |
| Fibonacci | 2,494.16 | 2,512.92 | 2,524.50 | 2,543.25 | 2,562.01 | 2,573.59 | 2,592.34 |
| Pivot points | S3 | S2 | S1 | PP | R1 | R2 | R3 |
|---|---|---|---|---|---|---|---|
| Standard | 2,412.37 | 2,442.13 | 2,469.76 | 2,499.52 | 2,527.15 | 2,556.91 | 2,584.54 |
| Camarilla | 2,481.61 | 2,486.87 | 2,492.13 | 2,497.39 | 2,502.65 | 2,507.91 | 2,513.17 |
| Woodie | 2,411.31 | 2,441.60 | 2,468.70 | 2,498.99 | 2,526.09 | 2,556.38 | 2,583.48 |
| Fibonacci | 2,442.13 | 2,464.05 | 2,477.60 | 2,499.52 | 2,521.44 | 2,534.99 | 2,556.91 |
| Pivot points | S3 | S2 | S1 | PP | R1 | R2 | R3 |
|---|---|---|---|---|---|---|---|
| Standard | 2,233.73 | 2,299.04 | 2,401.13 | 2,466.44 | 2,568.53 | 2,633.84 | 2,735.93 |
| Camarilla | 2,457.20 | 2,472.54 | 2,487.89 | 2,503.23 | 2,518.58 | 2,533.92 | 2,549.27 |
| Woodie | 2,252.13 | 2,308.24 | 2,419.53 | 2,475.64 | 2,586.93 | 2,643.04 | 2,754.33 |
| Fibonacci | 2,299.04 | 2,362.98 | 2,402.49 | 2,466.44 | 2,530.38 | 2,569.89 | 2,633.84 |
Numerical data
The following is the status of technical indicators and moving averages registered at the time this technical analysis was created:
| RSI (14): | 50.16 | |
| MACD (12,26,9): | 0.4100 | |
| Directional Movement: | 3.07 | |
| AROON (14): | -35.71 | |
| DEMA (21): | 2,568.38 | |
| Parabolic SAR (0,02-0,02-0,2): | 2,571.19 | |
| Elder Ray (13): | -0.97 | |
| Super Trend (3,10): | 2,562.94 | |
| Zig ZAG (10): | 2,566.31 | |
| VORTEX (21): | 1.0400 | |
| Stochastique (14,3,5): | 14.46 | |
| TEMA (21): | 2,566.74 | |
| Williams %R (14): | -99.76 | |
| Chande Momentum Oscillator (20): | -2.51 | |
| Repulse (5,40,3): | -0.1300 | |
| ROCnROLL: | -1 | |
| TRIX (15,9): | 0.0000 | |
| Courbe Coppock: | 0.07 |
| MA7: | 2,525.42 | |
| MA20: | 2,513.26 | |
| MA50: | 2,456.98 | |
| MA100: | 2,398.83 | |
| MAexp7: | 2,566.65 | |
| MAexp20: | 2,567.60 | |
| MAexp50: | 2,564.32 | |
| MAexp100: | 2,555.57 | |
| Price / MA7: | +1.67% | |
| Price / MA20: | +2.16% | |
| Price / MA50: | +4.50% | |
| Price / MA100: | +7.04% | |
| Price / MAexp7: | +0.04% | |
| Price / MAexp20: | +0.00% | |
| Price / MAexp50: | +0.13% | |
| Price / MAexp100: | +0.47% |
News
Don't forget to follow the news on GOLD - USD. At the time of publication of this analysis, the latest news was as follows:
-
 Gold at record high
-
Gold Breaks to Record Highs: Forecast & Technical Analysis by Bruce Powers (September 12)
-
Gold Forecast September 13, 2024
-
Gold Takes Off After ECB: Forecast & Technical Analysis by Chris Lewis (September 12)
-
Technical Analysis on EURJPY, USDCHF, Gold
About author

Online


Add a comment
Comments
0 comments on the analysis GOLD - USD - 15 min.