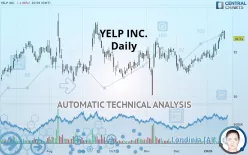
YELP INC. - Daily - Technical analysis published on 01/21/2020 (GMT)
- 341
- 0
- Who voted?
Click here for a new analysis!
- Timeframe : Daily
- - Analysis generated on
- Status : INVALID

Summary of the analysis

Additional analysis
Quotes
The YELP INC. price is 36.51 USD. The price is lower by -1.96% since the last closing and was traded between 36.42 USD and 37.42 USD over the period. The price is currently at +0.25% from its lowest and -2.43% from its highest.The Central Gaps scanner detects a bullish opening marking the presence of buyers ahead of sellers at the opening but not sufficiently marked to allow the price to register a quotation gap.
Bullish opening
Type : Bullish
Timeframe : Openning
Here is a more detailed summary of the historical variations registered by YELP INC.:
Near a new HIGH record (1st january)
Type : Bullish
Timeframe : Weekly
Near a new HIGH record (1 month)
Type : Bullish
Timeframe : Weekly
Technical
A technical analysis in Daily of this YELP INC. chart shows a strongly bullish trend. 92.86% of the signals given by moving averages are bullish. The overall trend is supported by the strong bullish signals from short-term moving averages. There is no crossing of moving average by the price or crossing of moving averages between themselves.
An assessment of technical indicators shows a moderate bullish signal.
But beware of excesses. The Central Indicators scanner currently detects this:
RSI indicator is overbought : over 70
Type : Neutral
Timeframe : Daily
CCI indicator is overbought : over 100
Type : Neutral
Timeframe : Daily
Williams %R indicator is overbought : over -20
Type : Neutral
Timeframe : Daily
Pivot points : price is over resistance 1
Type : Neutral
Timeframe : Weekly
Pivot points : price is under support 1
Type : Neutral
Timeframe : Daily
Price is back over the pivot point
Type : Bullish
Timeframe : Daily
Central Patterns, the scanner specializing in chart patterns, did not identify any signals.
No result was found by the Central Candlesticks scanner on Japanese candlesticks.
| S3 | S2 | S1 | Price | R1 | R2 | R3 | |
|---|---|---|---|---|---|---|---|
| ProTrendLines | 31.77 | 34.44 | 36.04 | 36.51 | 38.21 | 40.93 | 47.75 |
| Change (%) | -12.98% | -5.67% | -1.29% | - | +4.66% | +12.11% | +30.79% |
| Change | -4.74 | -2.07 | -0.47 | - | +1.70 | +4.42 | +11.24 |
| Level | Minor | Minor | Major | - | Intermediate | Major | Minor |
To determine price objectives, it is also possible to use the pivot points. Here is the price position in relation to pivot points:
| Pivot points | S3 | S2 | S1 | PP | R1 | R2 | R3 |
|---|---|---|---|---|---|---|---|
| Standard | 36.17 | 36.49 | 36.86 | 37.18 | 37.55 | 37.87 | 38.24 |
| Camarilla | 37.05 | 37.11 | 37.18 | 37.24 | 37.30 | 37.37 | 37.43 |
| Woodie | 36.21 | 36.50 | 36.90 | 37.19 | 37.59 | 37.88 | 38.28 |
| Fibonacci | 36.49 | 36.75 | 36.91 | 37.18 | 37.44 | 37.60 | 37.87 |
| Pivot points | S3 | S2 | S1 | PP | R1 | R2 | R3 |
|---|---|---|---|---|---|---|---|
| Standard | 32.19 | 33.11 | 34.19 | 35.11 | 36.19 | 37.11 | 38.19 |
| Camarilla | 34.73 | 34.91 | 35.10 | 35.28 | 35.46 | 35.65 | 35.83 |
| Woodie | 32.28 | 33.15 | 34.28 | 35.15 | 36.28 | 37.15 | 38.28 |
| Fibonacci | 33.11 | 33.87 | 34.34 | 35.11 | 35.87 | 36.34 | 37.11 |
| Pivot points | S3 | S2 | S1 | PP | R1 | R2 | R3 |
|---|---|---|---|---|---|---|---|
| Standard | 30.61 | 31.58 | 33.20 | 34.17 | 35.79 | 36.76 | 38.38 |
| Camarilla | 34.12 | 34.36 | 34.59 | 34.83 | 35.07 | 35.31 | 35.54 |
| Woodie | 30.95 | 31.74 | 33.54 | 34.33 | 36.13 | 36.92 | 38.72 |
| Fibonacci | 31.58 | 32.57 | 33.18 | 34.17 | 35.16 | 35.77 | 36.76 |
Numerical data
The following is the status of the technical indicators and moving averages at the time of publication of this technical analysis:
| RSI (14): | 63.21 | |
| MACD (12,26,9): | 0.6900 | |
| Directional Movement: | 15.78 | |
| AROON (14): | 50.00 | |
| DEMA (21): | 36.22 | |
| Parabolic SAR (0,02-0,02-0,2): | 35.90 | |
| Elder Ray (13): | 1.10 | |
| Super Trend (3,10): | 34.76 | |
| Zig ZAG (10): | 36.51 | |
| VORTEX (21): | 1.2000 | |
| Stochastique (14,3,5): | 85.09 | |
| TEMA (21): | 36.73 | |
| Williams %R (14): | -28.24 | |
| Chande Momentum Oscillator (20): | 1.68 | |
| Repulse (5,40,3): | -0.9600 | |
| ROCnROLL: | 1 | |
| TRIX (15,9): | 0.1900 | |
| Courbe Coppock: | 10.81 |
| MA7: | 36.28 | |
| MA20: | 35.17 | |
| MA50: | 34.51 | |
| MA100: | 34.34 | |
| MAexp7: | 36.34 | |
| MAexp20: | 35.43 | |
| MAexp50: | 34.76 | |
| MAexp100: | 34.50 | |
| Price / MA7: | +0.63% | |
| Price / MA20: | +3.81% | |
| Price / MA50: | +5.80% | |
| Price / MA100: | +6.32% | |
| Price / MAexp7: | +0.47% | |
| Price / MAexp20: | +3.05% | |
| Price / MAexp50: | +5.03% | |
| Price / MAexp100: | +5.83% |
News
The last news published on YELP INC. at the time of the generation of this analysis was as follows:
- Yelp Economic Average Finds California’s Urban Centers are Declining
- Yelp Announces New Restaurant Solutions To Better Reach Diners and Save Consumers Time
- Small Business Owners Can Now Easily Create and Claim their Yelp Listing within GoDaddy's GoCentral Platform
- Yelp Reports First Quarter 2019 Financial Results
- Northeast Business Group on Health and Yelp Announce Partnership to Display Maternity Care Measures for New York City and Long Island Hospitals
About author

Online


Add a comment
Comments
0 comments on the analysis YELP INC. - Daily