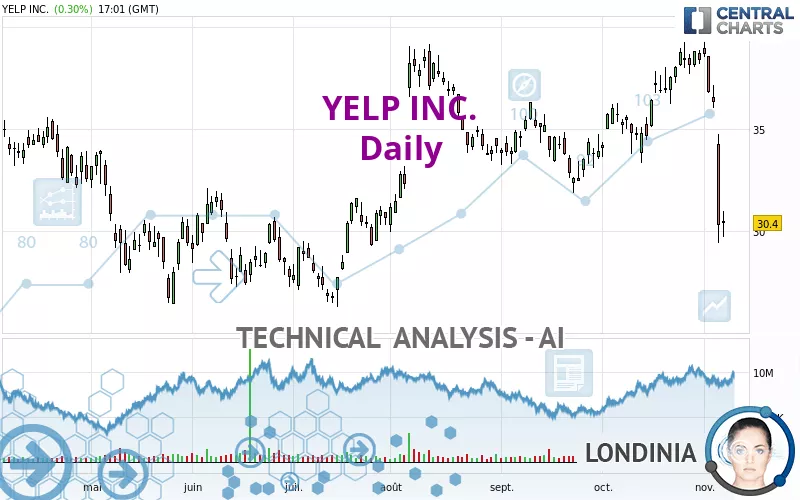
YELP INC. - Daily - Technical analysis published on 11/07/2022 (GMT)
- 207
- 0
Click here for a new analysis!
- Timeframe : Daily
- - Analysis generated on
- Status : TARGET REACHED

Summary of the analysis

Additional analysis
Quotes
YELP INC. rating 30.40 USD. The price registered an increase of +0.30% on the session with the lowest point at 29.73 USD and the highest point at 31.00 USD. The deviation from the price is +2.25% for the low point and -1.94% for the high point.The Central Gaps scanner detects a bullish opening. A small advantage for buyers in the very short term.
Bullish opening
Type : Bullish
Timeframe : Openning
So that you have an overall view of the price change, here is a table showing the variations over several periods:
Near a new LOW record (1 month)
Type : Bearish
Timeframe : Weekly
Technical
A technical analysis in Daily of this YELP INC. chart shows a slightly bearish trend. 60.71% of the signals given by moving averages are bearish. The overall trend could accelerate as a result of the strong bearish signals from short-term moving averages. The Central Indicators scanner detects bearish signals on moving averages that could impact this trend:
Bearish trend reversal : Moving Average 20
Type : Bearish
Timeframe : Daily
Bearish trend reversal : Moving Average 50
Type : Bearish
Timeframe : Daily
Bearish trend reversal : adaptative moving average 50
Type : Bearish
Timeframe : Daily
Bearish trend reversal : adaptative moving average 100
Type : Bearish
Timeframe : Daily
Technical indicators are bearish. There is still some doubt about the decline in the price.
Caution: the Central Indicators scanner currently detects an excess:
RSI indicator is oversold : under 30
Type : Neutral
Timeframe : Daily
CCI indicator is oversold : under -100
Type : Neutral
Timeframe : Daily
Previous candle closed under Bollinger bands
Type : Neutral
Timeframe : Daily
Williams %R indicator is oversold : under -80
Type : Neutral
Timeframe : Daily
MACD indicator is back under 0
Type : Bearish
Timeframe : Daily
Central Patterns, the scanner specializing in chart patterns, did not identify any signals.
For a small rebound in the very short term, the Central Candlesticks scanner currently notes the presence of this bullish pattern in Japanese candlesticks:
Bullish harami cross
Type : Bullish
Timeframe : Daily
| S2 | S1 | Price | R1 | R2 | R3 | |
|---|---|---|---|---|---|---|
| ProTrendLines | 14.87 | 27.06 | 30.40 | 30.70 | 32.53 | 35.93 |
| Change (%) | -51.09% | -10.99% | - | +0.99% | +7.01% | +18.19% |
| Change | -15.53 | -3.34 | - | +0.30 | +2.13 | +5.53 |
| Level | Major | Major | - | Minor | Major | Major |
Pivot points can also be used to set your price objectives. Here is the price situation in relation to pivot points:
| Pivot points | S3 | S2 | S1 | PP | R1 | R2 | R3 |
|---|---|---|---|---|---|---|---|
| Standard | 22.94 | 26.18 | 28.25 | 31.49 | 33.56 | 36.80 | 38.87 |
| Camarilla | 28.85 | 29.34 | 29.82 | 30.31 | 30.80 | 31.28 | 31.77 |
| Woodie | 22.35 | 25.89 | 27.66 | 31.20 | 32.97 | 36.51 | 38.28 |
| Fibonacci | 26.18 | 28.21 | 29.47 | 31.49 | 33.52 | 34.78 | 36.80 |
| Pivot points | S3 | S2 | S1 | PP | R1 | R2 | R3 |
|---|---|---|---|---|---|---|---|
| Standard | 16.94 | 23.18 | 26.75 | 32.99 | 36.56 | 42.80 | 46.37 |
| Camarilla | 27.61 | 28.51 | 29.41 | 30.31 | 31.21 | 32.11 | 33.01 |
| Woodie | 15.60 | 22.51 | 25.41 | 32.32 | 35.22 | 42.13 | 45.03 |
| Fibonacci | 23.18 | 26.93 | 29.25 | 32.99 | 36.74 | 39.06 | 42.80 |
| Pivot points | S3 | S2 | S1 | PP | R1 | R2 | R3 |
|---|---|---|---|---|---|---|---|
| Standard | 28.81 | 31.07 | 34.74 | 37.00 | 40.67 | 42.93 | 46.60 |
| Camarilla | 36.78 | 37.32 | 37.87 | 38.41 | 38.95 | 39.50 | 40.04 |
| Woodie | 29.52 | 31.42 | 35.45 | 37.35 | 41.38 | 43.28 | 47.31 |
| Fibonacci | 31.07 | 33.34 | 34.74 | 37.00 | 39.27 | 40.67 | 42.93 |
Numerical data
The following is the status of technical indicators and moving averages registered at the time this technical analysis was created:
| RSI (14): | 26.78 | |
| MACD (12,26,9): | -0.3600 | |
| Directional Movement: | -31.16 | |
| AROON (14): | -50.00 | |
| DEMA (21): | 35.68 | |
| Parabolic SAR (0,02-0,02-0,2): | 38.53 | |
| Elder Ray (13): | -5.14 | |
| Super Trend (3,10): | 35.34 | |
| Zig ZAG (10): | 30.42 | |
| VORTEX (21): | 0.8300 | |
| Stochastique (14,3,5): | 16.24 | |
| TEMA (21): | 34.84 | |
| Williams %R (14): | -90.18 | |
| Chande Momentum Oscillator (20): | -6.60 | |
| Repulse (5,40,3): | -13.7200 | |
| ROCnROLL: | 2 | |
| TRIX (15,9): | 0.2300 | |
| Courbe Coppock: | 4.13 |
| MA7: | 35.67 | |
| MA20: | 36.36 | |
| MA50: | 35.20 | |
| MA100: | 33.44 | |
| MAexp7: | 34.38 | |
| MAexp20: | 35.77 | |
| MAexp50: | 35.27 | |
| MAexp100: | 34.37 | |
| Price / MA7: | -14.77% | |
| Price / MA20: | -16.39% | |
| Price / MA50: | -13.64% | |
| Price / MA100: | -9.09% | |
| Price / MAexp7: | -11.58% | |
| Price / MAexp20: | -15.01% | |
| Price / MAexp50: | -13.81% | |
| Price / MAexp100: | -11.55% |
News
The last news published on YELP INC. at the time of the generation of this analysis was as follows:
- Yelp Reports Record Net Revenue in the Third Quarter 2022
- Yelp Announces Date of Third Quarter 2022 Financial Results
- Q3 Yelp Economic Average Finds that Consumers’ Inflationary Experiences Intensify Across the U.S., as People Increasingly Turn to Budget Options
- Yelp to Participate in the Goldman Sachs Communacopia and Technology Conference
- Yelp's Strong Advertiser Demand Drove Record Net Revenue in the Second Quarter 2022
About author

Online


Add a comment
Comments
0 comments on the analysis YELP INC. - Daily