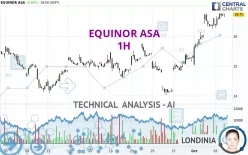
EQUINOR ASA - 1H - Technical analysis published on 10/04/2024 (GMT)
- 119
- 0
Click here for a new analysis!
- Timeframe : 1H
- - Analysis generated on
- Status : INVALID

Summary of the analysis

Additional analysis
Quotes
The EQUINOR ASA rating is 26.75 USD. On the day, this instrument gained +0.60% with the lowest point at 26.29 USD and the highest point at 26.77 USD. The deviation from the price is +1.75% for the low point and -0.07% for the high point.The Central Gaps scanner detects a bearish opening marking the presence of sellers ahead of buyers at the opening but not sufficiently marked to allow the price to register a quotation gap.
Bearish opening
Type : Bearish
Timeframe : Openning
Here is a more detailed summary of the historical variations registered by EQUINOR ASA:
Near a new HIGH record (1 month)
Type : Bullish
Timeframe : Weekly
Technical
Technical analysis of this 1H chart of EQUINOR ASA indicates that the overall trend is strongly bullish. 92.86% of the signals given by moving averages are bullish. The overall trend is supported by the strong bullish signals from short-term moving averages. The Central Indicators scanner does not detect any result on moving averages that would impact this trend.
An assessment of technical indicators shows a moderate bullish signal.
Caution: the Central Indicators scanner currently detects an excess:
RSI indicator is overbought : over 70
Type : Neutral
Timeframe : 1 hour
Williams %R indicator is overbought : over -20
Type : Neutral
Timeframe : 1 hour
Pivot points : price is over resistance 2
Type : Neutral
Timeframe : Weekly
MACD crosses DOWN its Moving Average
Type : Bearish
Timeframe : 1 hour
Central Patterns, the market scanner focusing on chart patterns, resistances and supports found these results:
Near horizontal resistance
Type : Bearish
Timeframe : 1 hour
Near resistance of channel
Type : Bearish
Timeframe : 1 hour
Near resistance of triangle
Type : Bearish
Timeframe : 1 hour
No result was found by the Central Candlesticks scanner on Japanese candlesticks.
| S3 | S2 | S1 | Price | R1 | R2 | R3 | |
|---|---|---|---|---|---|---|---|
| ProTrendLines | 25.79 | 26.26 | 26.71 | 26.75 | 27.29 | 27.78 | 28.76 |
| Change (%) | -3.59% | -1.83% | -0.15% | - | +2.02% | +3.85% | +7.51% |
| Change | -0.96 | -0.49 | -0.04 | - | +0.54 | +1.03 | +2.01 |
| Level | Major | Minor | Major | - | Minor | Intermediate | Major |
Pivot points can also be used to set your price objectives. Here is the price situation in relation to pivot points:
| Pivot points | S3 | S2 | S1 | PP | R1 | R2 | R3 |
|---|---|---|---|---|---|---|---|
| Standard | 25.96 | 26.12 | 26.44 | 26.60 | 26.92 | 27.08 | 27.40 |
| Camarilla | 26.62 | 26.66 | 26.71 | 26.75 | 26.79 | 26.84 | 26.88 |
| Woodie | 26.03 | 26.16 | 26.51 | 26.64 | 26.99 | 27.12 | 27.47 |
| Fibonacci | 26.12 | 26.31 | 26.42 | 26.60 | 26.79 | 26.90 | 27.08 |
| Pivot points | S3 | S2 | S1 | PP | R1 | R2 | R3 |
|---|---|---|---|---|---|---|---|
| Standard | 22.36 | 23.19 | 24.09 | 24.92 | 25.82 | 26.65 | 27.55 |
| Camarilla | 24.51 | 24.67 | 24.83 | 24.99 | 25.15 | 25.31 | 25.47 |
| Woodie | 22.40 | 23.21 | 24.13 | 24.94 | 25.86 | 26.67 | 27.59 |
| Fibonacci | 23.19 | 23.85 | 24.26 | 24.92 | 25.58 | 25.99 | 26.65 |
| Pivot points | S3 | S2 | S1 | PP | R1 | R2 | R3 |
|---|---|---|---|---|---|---|---|
| Standard | 22.40 | 23.21 | 24.27 | 25.08 | 26.14 | 26.95 | 28.01 |
| Camarilla | 24.82 | 24.99 | 25.16 | 25.33 | 25.50 | 25.67 | 25.84 |
| Woodie | 22.53 | 23.27 | 24.40 | 25.14 | 26.27 | 27.01 | 28.14 |
| Fibonacci | 23.21 | 23.92 | 24.37 | 25.08 | 25.79 | 26.24 | 26.95 |
Numerical data
The following are the details of the technical indicators and moving averages that were collected to generate this technical analysis:
| RSI (14): | 70.21 | |
| MACD (12,26,9): | 0.3600 | |
| Directional Movement: | 27.00 | |
| AROON (14): | 14.29 | |
| DEMA (21): | 26.80 | |
| Parabolic SAR (0,02-0,02-0,2): | 26.29 | |
| Elder Ray (13): | 0.19 | |
| Super Trend (3,10): | 26.14 | |
| Zig ZAG (10): | 26.75 | |
| VORTEX (21): | 1.1600 | |
| Stochastique (14,3,5): | 93.93 | |
| TEMA (21): | 26.91 | |
| Williams %R (14): | -5.83 | |
| Chande Momentum Oscillator (20): | 0.22 | |
| Repulse (5,40,3): | 0.7500 | |
| ROCnROLL: | 1 | |
| TRIX (15,9): | 0.2200 | |
| Courbe Coppock: | 4.88 |
| MA7: | 25.52 | |
| MA20: | 25.15 | |
| MA50: | 25.97 | |
| MA100: | 26.73 | |
| MAexp7: | 26.66 | |
| MAexp20: | 26.32 | |
| MAexp50: | 25.79 | |
| MAexp100: | 25.54 | |
| Price / MA7: | +4.82% | |
| Price / MA20: | +6.36% | |
| Price / MA50: | +3.00% | |
| Price / MA100: | +0.07% | |
| Price / MAexp7: | +0.34% | |
| Price / MAexp20: | +1.63% | |
| Price / MAexp50: | +3.72% | |
| Price / MAexp100: | +4.74% |
About author

Online


Add a comment
Comments
0 comments on the analysis EQUINOR ASA - 1H