EQUINOR ASA - Daily - Technical analysis published on 03/27/2022 (GMT)
- 328
- 0
Click here for a new analysis!
- Timeframe : Daily
- - Analysis generated on
- Status : TARGET REACHED
Summary of the analysis

Additional analysis
Quotes
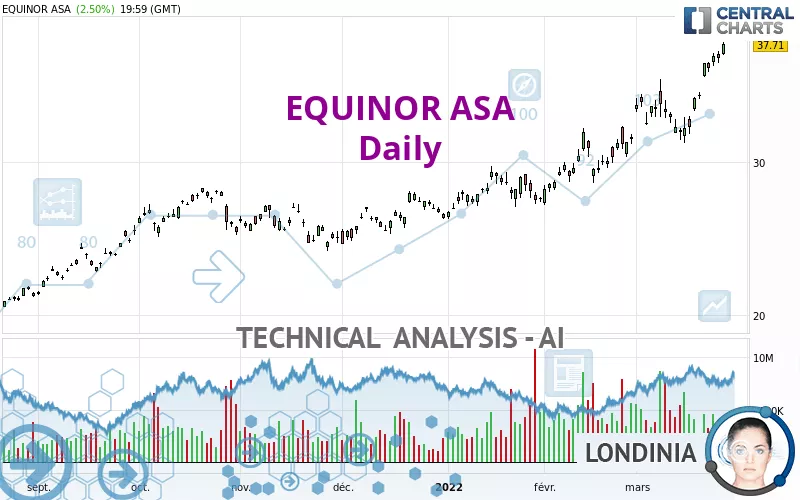
The EQUINOR ASA price is 37.71 USD. The price registered an increase of +2.50% on the session with the lowest point at 36.95 USD and the highest point at 37.81 USD. The deviation from the price is +2.06% for the low point and -0.26% for the high point.A bullish opening was detected by the Central Gaps scanner. Buyers are trying to impose a bullish momentum in the very short term.
Bullish opening
Type : Bullish
Timeframe : Openning
A study of price movements over other periods shows the following variations:
New HIGH record (1 year)
Type : Bullish
Timeframe : Weekly
New HIGH record (1st january)
Type : Bullish
Timeframe : Weekly
New HIGH record (1 month)
Type : Bullish
Timeframe : Weekly
Technical
A technical analysis in Daily of this EQUINOR ASA chart shows a strongly bullish trend. 92.86% of the signals given by moving averages are bullish. This strongly bullish trend is supported by the strong bullish signals given by short-term moving averages. There is no crossing of moving average by the price or crossing of moving averages between themselves.
Technical indicators are strongly bullish, suggesting that the price increase should continue.
Caution: the Central Indicators scanner currently detects an excess:
RSI indicator is overbought : over 70
Type : Neutral
Timeframe : Daily
CCI indicator is overbought : over 100
Type : Neutral
Timeframe : Daily
Williams %R indicator is overbought : over -20
Type : Neutral
Timeframe : Daily
Pivot points : price is over resistance 2
Type : Neutral
Timeframe : Daily
Pivot points : price is over resistance 2
Type : Neutral
Timeframe : Weekly
An analysis of the price chart with the Central Patterns scanner (detector of chart patterns and resistances and supports) shows a result that can have an impact on the price change:
Resistance of channel is broken
Type : Bullish
Timeframe : Daily
The Central Candlesticks scanner, specialised in Japanese candlesticks, did not identify any signals.
| S3 | S2 | S1 | Price | |
|---|---|---|---|---|
| ProTrendLines | 24.65 | 28.26 | 32.02 | 37.71 |
| Change (%) | -34.63% | -25.06% | -15.09% | - |
| Change | -13.06 | -9.45 | -5.69 | - |
| Level | Major | Minor | Major | - |
Attention could also be paid to pivot points to set price objectives:
| Pivot points | S3 | S2 | S1 | PP | R1 | R2 | R3 |
|---|---|---|---|---|---|---|---|
| Standard | 36.31 | 36.63 | 37.17 | 37.49 | 38.03 | 38.35 | 38.89 |
| Camarilla | 37.47 | 37.55 | 37.63 | 37.71 | 37.79 | 37.87 | 37.95 |
| Woodie | 36.42 | 36.69 | 37.28 | 37.55 | 38.14 | 38.41 | 39.00 |
| Fibonacci | 36.63 | 36.96 | 37.16 | 37.49 | 37.82 | 38.02 | 38.35 |
| Pivot points | S3 | S2 | S1 | PP | R1 | R2 | R3 |
|---|---|---|---|---|---|---|---|
| Standard | 33.96 | 34.75 | 36.23 | 37.02 | 38.50 | 39.29 | 40.77 |
| Camarilla | 37.09 | 37.29 | 37.50 | 37.71 | 37.92 | 38.13 | 38.33 |
| Woodie | 34.31 | 34.92 | 36.58 | 37.19 | 38.85 | 39.46 | 41.12 |
| Fibonacci | 34.75 | 35.62 | 36.15 | 37.02 | 37.89 | 38.42 | 39.29 |
| Pivot points | S3 | S2 | S1 | PP | R1 | R2 | R3 |
|---|---|---|---|---|---|---|---|
| Standard | 22.97 | 25.02 | 28.24 | 30.29 | 33.51 | 35.56 | 38.78 |
| Camarilla | 30.01 | 30.49 | 30.98 | 31.46 | 31.94 | 32.43 | 32.91 |
| Woodie | 23.56 | 25.31 | 28.83 | 30.58 | 34.10 | 35.85 | 39.37 |
| Fibonacci | 25.02 | 27.03 | 28.28 | 30.29 | 32.30 | 33.55 | 35.56 |
Numerical data
The following is the status of technical indicators and moving averages registered at the time this technical analysis was created:
| RSI (14): | 75.71 | |
| MACD (12,26,9): | 1.6400 | |
| Directional Movement: | 31.83 | |
| AROON (14): | 57.14 | |
| DEMA (21): | 36.20 | |
| Parabolic SAR (0,02-0,02-0,2): | 33.16 | |
| Elder Ray (13): | 2.35 | |
| Super Trend (3,10): | 33.88 | |
| Zig ZAG (10): | 37.71 | |
| VORTEX (21): | 1.0400 | |
| Stochastique (14,3,5): | 96.22 | |
| TEMA (21): | 36.82 | |
| Williams %R (14): | -1.45 | |
| Chande Momentum Oscillator (20): | 4.49 | |
| Repulse (5,40,3): | 3.3300 | |
| ROCnROLL: | 1 | |
| TRIX (15,9): | 0.5900 | |
| Courbe Coppock: | 17.34 |
| MA7: | 36.06 | |
| MA20: | 34.00 | |
| MA50: | 31.15 | |
| MA100: | 28.70 | |
| MAexp7: | 36.10 | |
| MAexp20: | 34.15 | |
| MAexp50: | 31.75 | |
| MAexp100: | 29.45 | |
| Price / MA7: | +4.58% | |
| Price / MA20: | +10.91% | |
| Price / MA50: | +21.06% | |
| Price / MA100: | +31.39% | |
| Price / MAexp7: | +4.46% | |
| Price / MAexp20: | +10.42% | |
| Price / MAexp50: | +18.77% | |
| Price / MAexp100: | +28.05% |
About author

Online


Add a comment
Comments
0 comments on the analysis EQUINOR ASA - Daily