| Open: | 151.00 |
| Change: | +3.79 |
| Volume: | 3,071,102 |
| Low: | 148.50 |
| High: | 153.02 |
| High / Low range: | 4.52 |
| Type: | Stocks |
| Ticker: | VIRP |
| ISIN: | FR0000031577 |
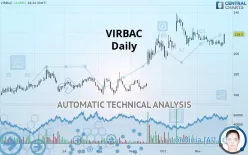
VIRBAC - Daily - Technical analysis published on 11/27/2019 (GMT)
- 341
- 0
- 11/27/2019 - 21:43
- Who voted?
Click here for a new analysis!
- Timeframe : Daily
- - Analysis generated on 11/27/2019 - 21:41
- Status : TARGET REACHED

Summary of the analysis

Additional analysis
Quotes
VIRBAC rating 218.5 EUR. The price registered an increase of +4.05% on the session and was traded between 209.5 EUR and 219.0 EUR over the period. The price is currently at +4.30% from its lowest and -0.23% from its highest.A bearish opening was detected by the Central Gaps scanner. Sellers are trying to impose a bearish trend in the very short term.
Bearish opening
Type : Bearish
Timeframe : Openning
Here is a more detailed summary of the historical variations registered by VIRBAC:
Technical
Technical analysis of this Daily chart of VIRBAC indicates that the overall trend is strongly bullish. 92.86% of the signals given by moving averages are bullish. This strongly bullish trend is supported by the strong bullish signals given by short-term moving averages. The Central Indicators market scanner is currently detecting a bullish signal that could impact this trend:
Bullish price crossover with adaptative moving average 50
Type : Bullish
Timeframe : Daily
In fact, 10 technical indicators on 18 studied are currently bullish. Caution: the Central Indicators scanner currently detects an excess:
CCI indicator: bullish divergence
Type : Bullish
Timeframe : Daily
RSI indicator: bullish divergence
Type : Bullish
Timeframe : Daily
Williams %R indicator is overbought : over -20
Type : Neutral
Timeframe : Daily
Pivot points : price is over resistance 3
Type : Neutral
Timeframe : Daily
Pivot points : price is over resistance 3
Type : Neutral
Timeframe : Weekly
The analysis of the price chart with Central Patterns scanners does not return any result.
The Central Candlesticks scanner which studies Japanese candlesticks did not detect anything.
| S3 | S2 | S1 | Price | R1 | R2 | |
|---|---|---|---|---|---|---|
| ProTrendLines | 184.4 | 196.5 | 208.6 | 218.5 | 223.8 | 254.9 |
| Change (%) | -15.61% | -10.07% | -4.53% | - | +2.43% | +16.66% |
| Change | -34.1 | -22.0 | -9.9 | - | +5.3 | +36.4 |
| Level | Major | Intermediate | Major | - | Major | Major |
To determine price objectives, it is also possible to use the pivot points. Here is the price position in relation to pivot points:
| Pivot points | S3 | S2 | S1 | PP | R1 | R2 | R3 |
|---|---|---|---|---|---|---|---|
| Standard | 203.7 | 205.3 | 207.7 | 209.3 | 211.7 | 213.3 | 215.7 |
| Camarilla | 208.9 | 209.3 | 209.6 | 210.0 | 210.4 | 210.7 | 211.1 |
| Woodie | 204.0 | 205.5 | 208.0 | 209.5 | 212.0 | 213.5 | 216.0 |
| Fibonacci | 205.3 | 206.9 | 207.8 | 209.3 | 210.9 | 211.8 | 213.3 |
| Pivot points | S3 | S2 | S1 | PP | R1 | R2 | R3 |
|---|---|---|---|---|---|---|---|
| Standard | 202.7 | 205.3 | 207.7 | 210.3 | 212.7 | 215.3 | 217.7 |
| Camarilla | 208.6 | 209.1 | 209.5 | 210.0 | 210.5 | 210.9 | 211.4 |
| Woodie | 202.5 | 205.3 | 207.5 | 210.3 | 212.5 | 215.3 | 217.5 |
| Fibonacci | 205.3 | 207.2 | 208.4 | 210.3 | 212.2 | 213.4 | 215.3 |
| Pivot points | S3 | S2 | S1 | PP | R1 | R2 | R3 |
|---|---|---|---|---|---|---|---|
| Standard | 150.0 | 171.9 | 195.2 | 217.1 | 240.4 | 262.3 | 285.6 |
| Camarilla | 206.1 | 210.2 | 214.4 | 218.5 | 222.6 | 226.8 | 230.9 |
| Woodie | 150.7 | 172.3 | 195.9 | 217.5 | 241.1 | 262.7 | 286.3 |
| Fibonacci | 171.9 | 189.2 | 199.8 | 217.1 | 234.4 | 245.0 | 262.3 |
Numerical data
The following is the status of the technical indicators and moving averages at the time of publication of this technical analysis:
| RSI (14): | 59.90 | |
| MACD (12,26,9): | 0.1000 | |
| Directional Movement: | 7.2 | |
| AROON (14): | 14.3 | |
| DEMA (21): | 212.8 | |
| Parabolic SAR (0,02-0,02-0,2): | 206.5 | |
| Elder Ray (13): | 2.2 | |
| Super Trend (3,10): | 203.5 | |
| Zig ZAG (10): | 218.5 | |
| VORTEX (21): | 1.0000 | |
| Stochastique (14,3,5): | 45.60 | |
| TEMA (21): | 209.8 | |
| Williams %R (14): | -4.00 | |
| Chande Momentum Oscillator (20): | 5.0 | |
| Repulse (5,40,3): | 5.3000 | |
| ROCnROLL: | 1 | |
| TRIX (15,9): | 0.0000 | |
| Courbe Coppock: | 3.10 |
| MA7: | 211.2 | |
| MA20: | 212.7 | |
| MA50: | 212.5 | |
| MA100: | 191.6 | |
| MAexp7: | 212.1 | |
| MAexp20: | 212.3 | |
| MAexp50: | 207.3 | |
| MAexp100: | 195.5 | |
| Price / MA7: | +3.46% | |
| Price / MA20: | +2.73% | |
| Price / MA50: | +2.82% | |
| Price / MA100: | +14.04% | |
| Price / MAexp7: | +3.02% | |
| Price / MAexp20: | +2.92% | |
| Price / MAexp50: | +5.40% | |
| Price / MAexp100: | +11.76% |
News
The last news published on VIRBAC at the time of the generation of this analysis was as follows:
- 10/11/2019 - 15:45 Virbac : solid +8.4% growth in revenue at constant exchange rates at the end of September, 2019
- 09/16/2019 - 15:45 Virbac: operating profit on the rise in the first half of 2019
- 09/06/2019 - 14:12 Virbac : Declaration of the number of share and voting right July 2019
- 05/16/2019 - 07:08 Virbac : availability of the quarterly financial information as of March 31, 2019
- 05/10/2019 - 07:43 Virbac : Declaration of the number of shares and voting rights April 2019
About author

Online


Add a comment
Comments
0 comments on the analysis VIRBAC - Daily