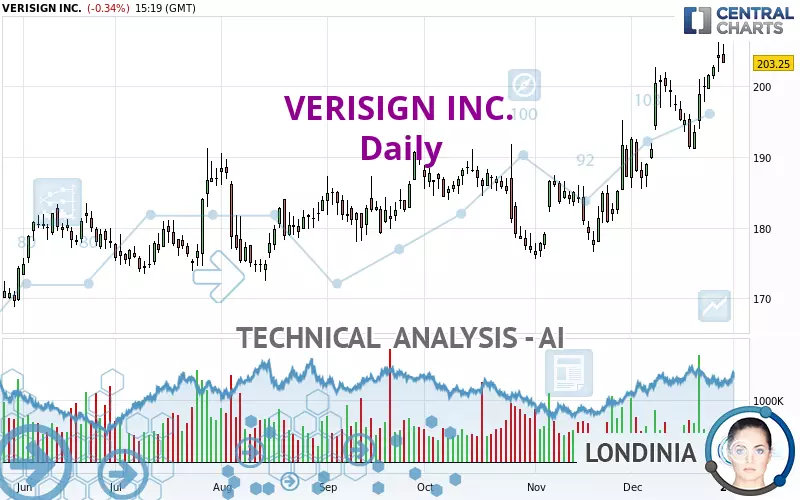
VERISIGN INC. - Daily - Technical analysis published on 12/30/2024 (GMT)
- 118
- 0
Click here for a new analysis!
- Timeframe : Daily
- - Analysis generated on
- Status : TARGET REACHED
Summary of the analysis

Additional analysis
Quotes
VERISIGN INC. rating 203.25 USD. The price is lower by -0.34% since the last closing with the lowest point at 203.25 USD and the highest point at 205.93 USD. The deviation from the price is 0% for the low point and -1.30% for the high point.Here is a more detailed summary of the historical variations registered by VERISIGN INC.:
Near a new HIGH record (1 year)
Type : Bullish
Timeframe : Weekly
Near a new HIGH record (1st january)
Type : Bullish
Timeframe : Weekly
New HIGH record (1 month)
Type : Bullish
Timeframe : Weekly
Technical
Technical analysis of this Daily chart of VERISIGN INC. indicates that the overall trend is strongly bullish. The signals given by the moving averages are 92.86% bullish. This strong bullish trend is confirmed by the strong signals currently being given by short-term moving averages. The Central Indicators market scanner currently does not detect any result that concerns moving averages.
In fact, 14 technical indicators on 18 studied are currently bullish. But beware of excesses. The Central Indicators scanner currently detects this:
CCI indicator is overbought : over 100
Type : Neutral
Timeframe : Daily
Williams %R indicator is overbought : over -20
Type : Neutral
Timeframe : Daily
An analysis of the price chart with the Central Patterns scanner (detector of chart patterns and resistances and supports) shows several results that can have an impact on the price change:
Near horizontal resistance
Type : Bearish
Timeframe : Daily
Resistance of channel is broken
Type : Bullish
Timeframe : Daily
There is also a Japanese candlestick pattern detected by Central Candlesticks that could mark the end of the current short-term trend:
Doji
Type : Neutral
Timeframe : Daily
| S3 | S2 | S1 | Price | R1 | R2 | R3 | |
|---|---|---|---|---|---|---|---|
| ProTrendLines | 181.87 | 188.32 | 200.53 | 203.25 | 206.61 | 228.54 | 245.70 |
| Change (%) | -10.52% | -7.35% | -1.34% | - | +1.65% | +12.44% | +20.89% |
| Change | -21.38 | -14.93 | -2.72 | - | +3.36 | +25.29 | +42.45 |
| Level | Major | Major | Intermediate | - | Intermediate | Major | Minor |
Pivot points can also be used to set your price objectives. Here is the price situation in relation to pivot points:
| Pivot points | S3 | S2 | S1 | PP | R1 | R2 | R3 |
|---|---|---|---|---|---|---|---|
| Standard | 197.58 | 199.76 | 201.85 | 204.03 | 206.12 | 208.30 | 210.39 |
| Camarilla | 202.78 | 203.17 | 203.56 | 203.95 | 204.34 | 204.73 | 205.12 |
| Woodie | 197.55 | 199.74 | 201.82 | 204.01 | 206.09 | 208.28 | 210.36 |
| Fibonacci | 199.76 | 201.39 | 202.40 | 204.03 | 205.66 | 206.67 | 208.30 |
| Pivot points | S3 | S2 | S1 | PP | R1 | R2 | R3 |
|---|---|---|---|---|---|---|---|
| Standard | 190.55 | 194.13 | 199.04 | 202.62 | 207.53 | 211.11 | 216.02 |
| Camarilla | 201.62 | 202.39 | 203.17 | 203.95 | 204.73 | 205.51 | 206.29 |
| Woodie | 191.22 | 194.46 | 199.71 | 202.95 | 208.20 | 211.44 | 216.69 |
| Fibonacci | 194.13 | 197.37 | 199.38 | 202.62 | 205.86 | 207.87 | 211.11 |
| Pivot points | S3 | S2 | S1 | PP | R1 | R2 | R3 |
|---|---|---|---|---|---|---|---|
| Standard | 157.31 | 166.47 | 176.82 | 185.98 | 196.33 | 205.49 | 215.84 |
| Camarilla | 181.82 | 183.60 | 185.39 | 187.18 | 188.97 | 190.76 | 192.55 |
| Woodie | 157.92 | 166.77 | 177.43 | 186.28 | 196.94 | 205.79 | 216.45 |
| Fibonacci | 166.47 | 173.92 | 178.52 | 185.98 | 193.43 | 198.03 | 205.49 |
Numerical data
The following are the details of the technical indicators and moving averages that were collected to generate this technical analysis:
| RSI (14): | 67.44 | |
| MACD (12,26,9): | 4.2200 | |
| Directional Movement: | 21.99 | |
| AROON (14): | 35.72 | |
| DEMA (21): | 202.04 | |
| Parabolic SAR (0,02-0,02-0,2): | 190.48 | |
| Elder Ray (13): | 5.63 | |
| Super Trend (3,10): | 193.31 | |
| Zig ZAG (10): | 204.30 | |
| VORTEX (21): | 1.1600 | |
| Stochastique (14,3,5): | 90.13 | |
| TEMA (21): | 203.77 | |
| Williams %R (14): | -14.69 | |
| Chande Momentum Oscillator (20): | 3.99 | |
| Repulse (5,40,3): | 0.4200 | |
| ROCnROLL: | 1 | |
| TRIX (15,9): | 0.2900 | |
| Courbe Coppock: | 7.52 |
| MA7: | 200.70 | |
| MA20: | 196.60 | |
| MA50: | 188.35 | |
| MA100: | 185.59 | |
| MAexp7: | 201.36 | |
| MAexp20: | 196.66 | |
| MAexp50: | 191.10 | |
| MAexp100: | 187.73 | |
| Price / MA7: | +1.27% | |
| Price / MA20: | +3.38% | |
| Price / MA50: | +7.91% | |
| Price / MA100: | +9.52% | |
| Price / MAexp7: | +0.94% | |
| Price / MAexp20: | +3.35% | |
| Price / MAexp50: | +6.36% | |
| Price / MAexp100: | +8.27% |
News
The last news published on VERISIGN INC. at the time of the generation of this analysis was as follows:
- Verisign Reports Second Quarter 2023 Results
- Verisign to Report Second Quarter 2023 Financial Results
- Verisign Reports Internet Has 354.0 Million Domain Name Registrations at the End of the First Quarter of 2023
- Verisign Statement Regarding ICANN’s Decision on .Web
- Verisign Reports First Quarter 2023 Results
About author
Online


Add a comment
Comments
0 comments on the analysis VERISIGN INC. - Daily