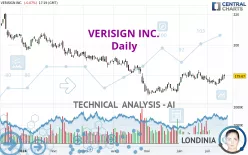
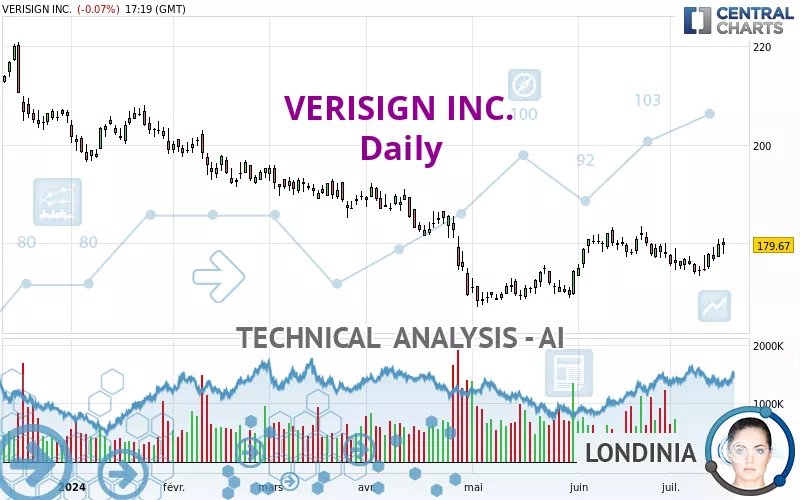
VERISIGN INC. - Daily - Technical analysis published on 07/17/2024 (GMT)
- 210
- 0
Click here for a new analysis!
- Timeframe : Daily
- - Analysis generated on
- Status : INVALID
Summary of the analysis

Additional analysis
Quotes
The VERISIGN INC. price is 179.66 USD. On the day, this instrument lost -0.08% with the lowest point at 177.86 USD and the highest point at 181.04 USD. The deviation from the price is +1.01% for the low point and -0.76% for the high point.The Central Gaps scanner detects a bullish opening marking the presence of buyers ahead of sellers at the opening but not sufficiently marked to allow the price to register a quotation gap.
Bullish opening
Type : Bullish
Timeframe : Openning
So that you have an overall view of the price change, here is a table showing the variations over several periods:
Near a new LOW record (1 month)
Type : Bearish
Timeframe : Weekly
Technical
Technical analysis of this Daily chart of VERISIGN INC. indicates that the overall trend is not clearly defined. The trend could quickly turn bullish due to the strong bullish signals currently being given by short-term moving averages. The Central Indicators market scanner is currently detecting a bullish signal that could impact this trend:
Bullish trend reversal : adaptative moving average 50
Type : Bullish
Timeframe : Daily
In fact, according to the parameters integrated into the Central Analyzer system, 15 technical indicators out of 18 analysed are currently bullish. But beware of excesses. The Central Indicators scanner currently detects this:
Williams %R indicator is overbought : over -20
Type : Neutral
Timeframe : Daily
Pivot points : price is over resistance 1
Type : Neutral
Timeframe : Weekly
MACD indicator is back over 0
Type : Bullish
Timeframe : Daily
The Central Patterns scanner, which studies chart patterns, resistances and supports, has identified this signal:
Near resistance of channel
Type : Bearish
Timeframe : Daily
The Central Candlesticks scanner currently notes the presence of this pattern in Japanese candlesticks that could mark the end of the short-term trend currently underway:
Doji
Type : Neutral
Timeframe : Daily
| S3 | S2 | S1 | Price | R1 | R2 | R3 | |
|---|---|---|---|---|---|---|---|
| ProTrendLines | 156.51 | 168.32 | 176.80 | 179.66 | 181.81 | 188.32 | 196.87 |
| Change (%) | -12.89% | -6.31% | -1.59% | - | +1.20% | +4.82% | +9.58% |
| Change | -23.15 | -11.34 | -2.86 | - | +2.15 | +8.66 | +17.21 |
| Level | Major | Major | Intermediate | - | Intermediate | Intermediate | Intermediate |
Pivot points can also be used to set your price objectives. Here is the price situation in relation to pivot points:
| Pivot points | S3 | S2 | S1 | PP | R1 | R2 | R3 |
|---|---|---|---|---|---|---|---|
| Standard | 174.11 | 175.69 | 177.75 | 179.33 | 181.39 | 182.97 | 185.03 |
| Camarilla | 178.80 | 179.13 | 179.47 | 179.80 | 180.13 | 180.47 | 180.80 |
| Woodie | 174.34 | 175.81 | 177.98 | 179.45 | 181.62 | 183.09 | 185.26 |
| Fibonacci | 175.69 | 177.08 | 177.94 | 179.33 | 180.72 | 181.58 | 182.97 |
| Pivot points | S3 | S2 | S1 | PP | R1 | R2 | R3 |
|---|---|---|---|---|---|---|---|
| Standard | 170.03 | 171.71 | 174.74 | 176.42 | 179.45 | 181.13 | 184.16 |
| Camarilla | 176.47 | 176.90 | 177.33 | 177.76 | 178.19 | 178.62 | 179.06 |
| Woodie | 170.70 | 172.05 | 175.41 | 176.76 | 180.12 | 181.47 | 184.83 |
| Fibonacci | 171.71 | 173.51 | 174.62 | 176.42 | 178.22 | 179.33 | 181.13 |
| Pivot points | S3 | S2 | S1 | PP | R1 | R2 | R3 |
|---|---|---|---|---|---|---|---|
| Standard | 162.77 | 168.05 | 172.93 | 178.21 | 183.09 | 188.37 | 193.25 |
| Camarilla | 175.01 | 175.94 | 176.87 | 177.80 | 178.73 | 179.66 | 180.59 |
| Woodie | 162.56 | 167.95 | 172.72 | 178.11 | 182.88 | 188.27 | 193.04 |
| Fibonacci | 168.05 | 171.93 | 174.33 | 178.21 | 182.09 | 184.49 | 188.37 |
Numerical data
The following are the details of the technical indicators and moving averages that were collected to generate this technical analysis:
| RSI (14): | 58.61 | |
| MACD (12,26,9): | 0.1800 | |
| Directional Movement: | 11.09 | |
| AROON (14): | 35.71 | |
| DEMA (21): | 177.56 | |
| Parabolic SAR (0,02-0,02-0,2): | 174.15 | |
| Elder Ray (13): | 1.99 | |
| Super Trend (3,10): | 173.96 | |
| Zig ZAG (10): | 180.15 | |
| VORTEX (21): | 0.9600 | |
| Stochastique (14,3,5): | 75.42 | |
| TEMA (21): | 177.72 | |
| Williams %R (14): | -12.30 | |
| Chande Momentum Oscillator (20): | 2.30 | |
| Repulse (5,40,3): | 1.2900 | |
| ROCnROLL: | 1 | |
| TRIX (15,9): | 0.0000 | |
| Courbe Coppock: | 1.75 |
| MA7: | 176.89 | |
| MA20: | 177.60 | |
| MA50: | 175.57 | |
| MA100: | 181.32 | |
| MAexp7: | 177.88 | |
| MAexp20: | 177.36 | |
| MAexp50: | 178.00 | |
| MAexp100: | 182.05 | |
| Price / MA7: | +1.57% | |
| Price / MA20: | +1.16% | |
| Price / MA50: | +2.33% | |
| Price / MA100: | -0.92% | |
| Price / MAexp7: | +1.00% | |
| Price / MAexp20: | +1.30% | |
| Price / MAexp50: | +0.93% | |
| Price / MAexp100: | -1.31% |
News
Don't forget to follow the news on VERISIGN INC.. At the time of publication of this analysis, the latest news was as follows:
- Verisign Reports Second Quarter 2023 Results
- Verisign to Report Second Quarter 2023 Financial Results
- Verisign Reports Internet Has 354.0 Million Domain Name Registrations at the End of the First Quarter of 2023
- Verisign Statement Regarding ICANN’s Decision on .Web
- Verisign Reports First Quarter 2023 Results
About author
Online


Add a comment
Comments
0 comments on the analysis VERISIGN INC. - Daily