| Open: | 0.1575 |
| Change: | -0.1235 |
| Volume: | 22 |
| Low: | 0.0010 |
| High: | 0.1625 |
| High / Low range: | 0.1615 |
| Type: | Stocks |
| Ticker: | VK |
| ISIN: | FR0013506730 |
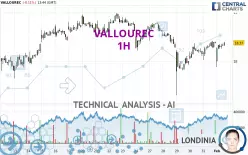
VALLOUREC - 1H - Technical analysis published on 02/03/2025 (GMT)
- 113
- 0
- 02/03/2025 - 14:00
Click here for a new analysis!
- Timeframe : 1H
- - Analysis generated on 02/03/2025 - 14:00
- Status : TARGET REACHED

Summary of the analysis

Additional analysis
Quotes
The VALLOUREC price is 18.370 EUR. On the day, this instrument lost -0.11% and was traded between 17.880 EUR and 18.390 EUR over the period. The price is currently at +2.74% from its lowest and -0.11% from its highest.The Central Gaps scanner detects a bearish gap which is a sign that the sellers have taken the lead in the very short term.
Opening Gap DOWN
Type : Bearish
Timeframe : Openning
A study of price movements over other periods shows the following variations:
Near a new HIGH record (5 years)
Type : Bullish
Timeframe : Weekly
Near a new HIGH record (1 year)
Type : Bullish
Timeframe : Weekly
Near a new HIGH record (1st january)
Type : Bullish
Timeframe : Weekly
Near a new HIGH record (1 month)
Type : Bullish
Timeframe : Weekly
Technical
Technical analysis of this 1H chart of VALLOUREC indicates that the overall trend is slightly bullish. Only 53.57% of the signals given by moving averages are bullish. This slightly bullish trend is reinforced by the strong signals currently being given by short-term moving averages. An assessment of moving averages reveals several bullish signals that could impact this trend:
Bullish price crossover with Moving Average 50
Type : Bullish
Timeframe : 1 hour
Bullish price crossover with adaptative moving average 50
Type : Bullish
Timeframe : 1 hour
In fact, 10 technical indicators on 18 studied are currently bullish. Caution: the Central Indicators scanner currently detects an excess:
Williams %R indicator is overbought : over -20
Type : Neutral
Timeframe : 1 hour
Parabolic SAR indicator bullish reversal
Type : Bullish
Timeframe : 1 hour
Price is back over the pivot point
Type : Bullish
Timeframe : Weekly
An analysis of the price chart with the Central Patterns scanner (detector of chart patterns and resistances and supports) shows several results that can have an impact on the price change:
Near horizontal resistance
Type : Bearish
Timeframe : 1 hour
Near resistance of channel
Type : Bearish
Timeframe : 1 hour
The Central Candlesticks scanner currently notes the presence of this pattern in Japanese candlesticks that could mark the end of the short-term trend currently underway:
Doji
Type : Neutral
Timeframe : 1 hour
| S3 | S2 | S1 | Price | R1 | R2 | R3 | |
|---|---|---|---|---|---|---|---|
| ProTrendLines | 17.210 | 17.645 | 18.115 | 18.370 | 18.499 | 18.835 | 83.286 |
| Change (%) | -6.31% | -3.95% | -1.39% | - | +0.70% | +2.53% | +353.38% |
| Change | -1.160 | -0.725 | -0.255 | - | +0.129 | +0.465 | +64.916 |
| Level | Minor | Intermediate | Major | - | Minor | Major | Minor |
Attention could also be paid to pivot points to set price objectives:
| Pivot points | S3 | S2 | S1 | PP | R1 | R2 | R3 |
|---|---|---|---|---|---|---|---|
| Standard | 17.768 | 17.897 | 18.143 | 18.272 | 18.518 | 18.647 | 18.893 |
| Camarilla | 18.287 | 18.321 | 18.356 | 18.390 | 18.424 | 18.459 | 18.493 |
| Woodie | 17.828 | 17.926 | 18.203 | 18.301 | 18.578 | 18.676 | 18.953 |
| Fibonacci | 17.897 | 18.040 | 18.128 | 18.272 | 18.415 | 18.503 | 18.647 |
| Pivot points | S3 | S2 | S1 | PP | R1 | R2 | R3 |
|---|---|---|---|---|---|---|---|
| Standard | 16.027 | 16.663 | 17.527 | 18.163 | 19.027 | 19.663 | 20.527 |
| Camarilla | 17.978 | 18.115 | 18.253 | 18.390 | 18.528 | 18.665 | 18.803 |
| Woodie | 16.140 | 16.720 | 17.640 | 18.220 | 19.140 | 19.720 | 20.640 |
| Fibonacci | 16.663 | 17.236 | 17.590 | 18.163 | 18.736 | 19.090 | 19.663 |
| Pivot points | S3 | S2 | S1 | PP | R1 | R2 | R3 |
|---|---|---|---|---|---|---|---|
| Standard | 14.028 | 15.137 | 16.763 | 17.872 | 19.498 | 20.607 | 22.233 |
| Camarilla | 17.638 | 17.889 | 18.139 | 18.390 | 18.641 | 18.891 | 19.142 |
| Woodie | 14.288 | 15.266 | 17.023 | 18.001 | 19.758 | 20.736 | 22.493 |
| Fibonacci | 15.137 | 16.181 | 16.827 | 17.872 | 18.916 | 19.562 | 20.607 |
Numerical data
The following is the status of the technical indicators and moving averages at the time of publication of this technical analysis:
| RSI (14): | 54.43 | |
| MACD (12,26,9): | 0.0200 | |
| Directional Movement: | -17.212 | |
| AROON (14): | -21.429 | |
| DEMA (21): | 18.298 | |
| Parabolic SAR (0,02-0,02-0,2): | 17.880 | |
| Elder Ray (13): | 0.041 | |
| Super Trend (3,10): | 18.057 | |
| Zig ZAG (10): | 18.330 | |
| VORTEX (21): | 1.0980 | |
| Stochastique (14,3,5): | 83.65 | |
| TEMA (21): | 18.352 | |
| Williams %R (14): | -16.35 | |
| Chande Momentum Oscillator (20): | 0.050 | |
| Repulse (5,40,3): | 0.1560 | |
| ROCnROLL: | -1 | |
| TRIX (15,9): | 0.0110 | |
| Courbe Coppock: | 1.18 |
| MA7: | 18.352 | |
| MA20: | 18.322 | |
| MA50: | 17.295 | |
| MA100: | 15.860 | |
| MAexp7: | 18.315 | |
| MAexp20: | 18.284 | |
| MAexp50: | 18.319 | |
| MAexp100: | 18.312 | |
| Price / MA7: | +0.10% | |
| Price / MA20: | +0.26% | |
| Price / MA50: | +6.22% | |
| Price / MA100: | +15.83% | |
| Price / MAexp7: | +0.30% | |
| Price / MAexp20: | +0.47% | |
| Price / MAexp50: | +0.28% | |
| Price / MAexp100: | +0.32% |
News
The last news published on VALLOUREC at the time of the generation of this analysis was as follows:
- 04/26/2023 - 19:17 Hilco Global Announces Sale of All Assets at Vallourec Deutschland GmbH
- 04/26/2023 - 19:05 Hilco Global Announces Sale of All Assets at Vallourec Deutschland GmbH
- 05/25/2020 - 16:00 Vallourec: Disclosure of trading in own shares on 19 May 2020
- 05/15/2020 - 16:00 Vallourec: Monthly information relating to the total number of voting rights and shares comprising the share capital
- 04/23/2020 - 06:15 Vallourec launches a reverse stock split
About author
Online


Add a comment
Comments
0 comments on the analysis VALLOUREC - 1H