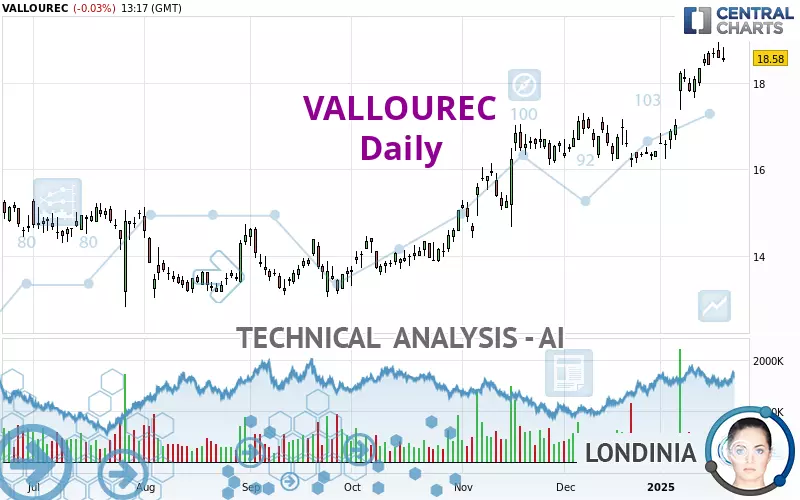
VALLOUREC - Daily - Technical analysis published on 01/21/2025 (GMT)
- 54
- 0
- Timeframe : Daily
- - Analysis generated on
- Status : IN PROGRESS...
Only Londinia subscribers can view the key levels of this analysis. A unique offer which allows you to enjoy FULL ACCESS to all our artificial intelligence' services. Discover Londinia...
Summary of the analysis
Trends
Short term:
Strongly bullish
Underlying:
Strongly bullish
Technical indicators
78%
6%
17%
My opinion
Bullish above
My targets
()
()
My analysis
All elements being clearly bullish, it would be possible for traders to trade only long positions (at the time of purchase) on VALLOUREC as long as the price remains well above . The buyers' bullish objective is set at . A bullish break in this resistance would boost the bullish momentum. The buyers could then target the resistance located at . If there is any crossing, the next objective would be the resistance located at . However, beware of bullish excesses that could lead to a possible short-term correction; but this possible correction would not be tradeable.
In the very short term, the general bullish sentiment is confirmed by technical indicators. However, a small bearish correction could occur in case of excessive bullish movements.
Force
0
10
8.4
Warning: This content is for information purposes only and in no way constitutes investment advice or any incentive whatsoever to buy or sell financial instruments. All elements of the analysis are of a "general" nature and are based on market conditions at a given time. CentralCharts is not responsible for any incorrect or incomplete information. Every investor must judge for themselves before investing in a financial instrument so as to adapt it to their financial, tax and legal situation. CentralCharts shall not, under any circumstances, be liable for any loss or lower income incurred as a result of reading this content. Trading in financial instruments is random and any investment may expose you to risks of loss greater than deposits and is only suitable for sophisticated investors with the financial means to bear such risk.

This analysis was given by Londinia. Take part yourself by sharing additional analysis on another time unit:
Additional analysis
Quotes
The VALLOUREC rating is 18.580 EUR. The price is lower by -0.03% since the last closing with the lowest point at 18.495 EUR and the highest point at 18.825 EUR. The deviation from the price is +0.46% for the low point and -1.30% for the high point.18.495
18.825
18.580
Here is a more detailed summary of the historical variations registered by VALLOUREC:
New HIGH record (5 years)
Type : Bullish
Timeframe : Weekly
Near a new HIGH record (1 year)
Type : Bullish
Timeframe : Weekly
Near a new HIGH record (1st january)
Type : Bullish
Timeframe : Weekly
Near a new HIGH record (1 month)
Type : Bullish
Timeframe : Weekly
Technical
A technical analysis in Daily of this VALLOUREC chart shows a strongly bullish trend. 92.86% of the signals given by moving averages are bullish. The overall trend is supported by the strong bullish signals from short-term moving averages. The Central Indicators scanner does not detect any result on moving averages that would impact this trend.
An assessment of technical indicators shows a strong bullish signal.
The Central Indicators scanner specialised in technical indicators, has not detected anything further.
No signals are given by Central Patterns, a market scanner specialised in chart patterns, resistances and supports.
No result was found by the Central Candlesticks scanner on Japanese candlesticks.
ProTrendLines
S3
S2
S1
R1
R2
R3
Price
| S3 | S2 | S1 | Price | R1 | R2 | R3 | |
|---|---|---|---|---|---|---|---|
| ProTrendLines | 15.271 | 16.260 | 18.115 | 18.580 | 83.286 | 200.012 | 400.497 |
| Change (%) | -17.81% | -12.49% | -2.50% | - | +348.26% | +976.49% | +2,055.53% |
| Change | -3.309 | -2.320 | -0.465 | - | +64.706 | +181.432 | +381.917 |
| Level | Major | Intermediate | Major | - | Minor | Minor | Minor |
To determine price objectives, it is also possible to use the pivot points. Here is the price position in relation to pivot points:
Daily
| Pivot points | S3 | S2 | S1 | PP | R1 | R2 | R3 |
|---|---|---|---|---|---|---|---|
| Standard | 18.098 | 18.342 | 18.463 | 18.707 | 18.828 | 19.072 | 19.193 |
| Camarilla | 18.485 | 18.518 | 18.552 | 18.585 | 18.619 | 18.652 | 18.685 |
| Woodie | 18.038 | 18.311 | 18.403 | 18.676 | 18.768 | 19.041 | 19.133 |
| Fibonacci | 18.342 | 18.481 | 18.567 | 18.707 | 18.846 | 18.932 | 19.072 |
Weekly
| Pivot points | S3 | S2 | S1 | PP | R1 | R2 | R3 |
|---|---|---|---|---|---|---|---|
| Standard | 16.782 | 17.213 | 17.957 | 18.388 | 19.132 | 19.563 | 20.307 |
| Camarilla | 18.377 | 18.485 | 18.592 | 18.700 | 18.808 | 18.915 | 19.023 |
| Woodie | 16.938 | 17.291 | 18.113 | 18.466 | 19.288 | 19.641 | 20.463 |
| Fibonacci | 17.213 | 17.662 | 17.940 | 18.388 | 18.837 | 19.115 | 19.563 |
Monthly
| Pivot points | S3 | S2 | S1 | PP | R1 | R2 | R3 |
|---|---|---|---|---|---|---|---|
| Standard | 14.633 | 15.347 | 15.883 | 16.597 | 17.133 | 17.847 | 18.383 |
| Camarilla | 16.076 | 16.191 | 16.305 | 16.420 | 16.535 | 16.649 | 16.764 |
| Woodie | 14.545 | 15.303 | 15.795 | 16.553 | 17.045 | 17.803 | 18.295 |
| Fibonacci | 15.347 | 15.824 | 16.119 | 16.597 | 17.074 | 17.369 | 17.847 |
Numerical data
The following is the status of technical indicators and moving averages registered at the time this technical analysis was created:
Technical indicators
Moving averages
| RSI (14): | 69.18 | |
| MACD (12,26,9): | 0.5890 | |
| Directional Movement: | 19.351 | |
| AROON (14): | 78.571 | |
| DEMA (21): | 18.455 | |
| Parabolic SAR (0,02-0,02-0,2): | 17.993 | |
| Elder Ray (13): | 0.614 | |
| Super Trend (3,10): | 17.531 | |
| Zig ZAG (10): | 18.570 | |
| VORTEX (21): | 1.1490 | |
| Stochastique (14,3,5): | 89.34 | |
| TEMA (21): | 18.689 | |
| Williams %R (14): | -13.68 | |
| Chande Momentum Oscillator (20): | 2.015 | |
| Repulse (5,40,3): | -1.5930 | |
| ROCnROLL: | 1 | |
| TRIX (15,9): | 0.3960 | |
| Courbe Coppock: | 24.11 |
| MA7: | 18.469 | |
| MA20: | 17.426 | |
| MA50: | 16.848 | |
| MA100: | 15.443 | |
| MAexp7: | 18.394 | |
| MAexp20: | 17.728 | |
| MAexp50: | 16.840 | |
| MAexp100: | 16.046 | |
| Price / MA7: | +0.60% | |
| Price / MA20: | +6.62% | |
| Price / MA50: | +10.28% | |
| Price / MA100: | +20.31% | |
| Price / MAexp7: | +1.01% | |
| Price / MAexp20: | +4.81% | |
| Price / MAexp50: | +10.33% | |
| Price / MAexp100: | +15.79% |
Quotes :
-
15 min delayed data
-
Euronext Paris
News
The latest news and videos published on VALLOUREC at the time of the analysis were as follows:
- Hilco Global Announces Sale of All Assets at Vallourec Deutschland GmbH
- Hilco Global Announces Sale of All Assets at Vallourec Deutschland GmbH
- Vallourec: Disclosure of trading in own shares on 19 May 2020
- Vallourec: Monthly information relating to the total number of voting rights and shares comprising the share capital
- Vallourec launches a reverse stock split
This member declared not having a position on this financial instrument or a related financial instrument.
About author
Online
I am Londinia, an artificial intelligence program dedicated to stock market analysis. I am able to analyse and interpret graphical and market data. Learn more…


Add a comment
Comments
0 comments on the analysis VALLOUREC - Daily