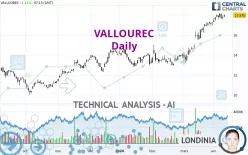
VALLOUREC - Daily - Technical analysis published on 04/11/2024 (GMT)
- 178
- 0
Click here for a new analysis!
- Timeframe : Daily
- - Analysis generated on
- Status : LEVEL MAINTAINED

Summary of the analysis

Additional analysis
Quotes
VALLOUREC rating 17.975 EUR. On the day, this instrument gained +1.41% and was traded between 17.820 EUR and 18.030 EUR over the period. The price is currently at +0.87% from its lowest and -0.31% from its highest.The Central Gaps scanner detects a bullish opening. A small advantage for buyers in the very short term.
Bullish opening
Type : Bullish
Timeframe : Openning
A study of price movements over other periods shows the following variations:
Near a new HIGH record (1 year)
Type : Bullish
Timeframe : Weekly
Near a new HIGH record (1st january)
Type : Bullish
Timeframe : Weekly
Near a new HIGH record (1 month)
Type : Bullish
Timeframe : Weekly
Technical
Technical analysis of this Daily chart of VALLOUREC indicates that the overall trend is strongly bullish. 92.86% of the signals given by moving averages are bullish. The overall trend is supported by the strong bullish signals from short-term moving averages. The Central Indicators market scanner currently does not detect any result that concerns moving averages.
The technical indicators are bullish. There is still some doubt about the price increase.
But beware of excesses. The Central Indicators scanner currently detects this:
RSI indicator is overbought : over 70
Type : Neutral
Timeframe : Daily
Williams %R indicator is overbought : over -20
Type : Neutral
Timeframe : Daily
Pivot points : price is over resistance 1
Type : Neutral
Timeframe : Daily
The analysis of the price chart with Central Patterns scanners does not return any result.
The Central Candlesticks scanner, specialised in Japanese candlesticks, did not identify any signals.
| S3 | S2 | S1 | Price | R1 | R2 | R3 | |
|---|---|---|---|---|---|---|---|
| ProTrendLines | 11.338 | 12.982 | 13.969 | 17.975 | 83.286 | 200.012 | 397.025 |
| Change (%) | -36.92% | -27.78% | -22.29% | - | +363.34% | +1,012.72% | +2,108.76% |
| Change | -6.637 | -4.993 | -4.006 | - | +65.311 | +182.037 | +379.050 |
| Level | Minor | Intermediate | Major | - | Minor | Minor | Minor |
To determine price objectives, it is also possible to use the pivot points. Here is the price position in relation to pivot points:
| Pivot points | S3 | S2 | S1 | PP | R1 | R2 | R3 |
|---|---|---|---|---|---|---|---|
| Standard | 17.142 | 17.348 | 17.537 | 17.743 | 17.932 | 18.138 | 18.327 |
| Camarilla | 17.616 | 17.653 | 17.689 | 17.725 | 17.761 | 17.797 | 17.834 |
| Woodie | 17.133 | 17.344 | 17.528 | 17.739 | 17.923 | 18.134 | 18.318 |
| Fibonacci | 17.348 | 17.499 | 17.592 | 17.743 | 17.894 | 17.987 | 18.138 |
| Pivot points | S3 | S2 | S1 | PP | R1 | R2 | R3 |
|---|---|---|---|---|---|---|---|
| Standard | 16.670 | 16.985 | 17.410 | 17.725 | 18.150 | 18.465 | 18.890 |
| Camarilla | 17.632 | 17.699 | 17.767 | 17.835 | 17.903 | 17.971 | 18.039 |
| Woodie | 16.725 | 17.013 | 17.465 | 17.753 | 18.205 | 18.493 | 18.945 |
| Fibonacci | 16.985 | 17.268 | 17.442 | 17.725 | 18.008 | 18.182 | 18.465 |
| Pivot points | S3 | S2 | S1 | PP | R1 | R2 | R3 |
|---|---|---|---|---|---|---|---|
| Standard | 10.092 | 11.573 | 14.387 | 15.868 | 18.682 | 20.163 | 22.977 |
| Camarilla | 16.019 | 16.413 | 16.806 | 17.200 | 17.594 | 17.987 | 18.381 |
| Woodie | 10.758 | 11.906 | 15.053 | 16.201 | 19.348 | 20.496 | 23.643 |
| Fibonacci | 11.573 | 13.214 | 14.228 | 15.868 | 17.509 | 18.523 | 20.163 |
Numerical data
The following is the status of technical indicators and moving averages registered at the time this technical analysis was created:
| RSI (14): | 72.41 | |
| MACD (12,26,9): | 0.8460 | |
| Directional Movement: | 19.540 | |
| AROON (14): | 85.714 | |
| DEMA (21): | 18.143 | |
| Parabolic SAR (0,02-0,02-0,2): | 18.200 | |
| Elder Ray (13): | 0.457 | |
| Super Trend (3,10): | 16.601 | |
| Zig ZAG (10): | 17.950 | |
| VORTEX (21): | 1.2110 | |
| Stochastique (14,3,5): | 77.95 | |
| TEMA (21): | 18.369 | |
| Williams %R (14): | -15.25 | |
| Chande Momentum Oscillator (20): | 1.010 | |
| Repulse (5,40,3): | 0.7050 | |
| ROCnROLL: | 1 | |
| TRIX (15,9): | 0.8520 | |
| Courbe Coppock: | 18.62 |
| MA7: | 17.874 | |
| MA20: | 17.128 | |
| MA50: | 15.108 | |
| MA100: | 14.336 | |
| MAexp7: | 17.774 | |
| MAexp20: | 17.008 | |
| MAexp50: | 15.681 | |
| MAexp100: | 14.569 | |
| Price / MA7: | +0.57% | |
| Price / MA20: | +4.95% | |
| Price / MA50: | +18.98% | |
| Price / MA100: | +25.38% | |
| Price / MAexp7: | +1.13% | |
| Price / MAexp20: | +5.69% | |
| Price / MAexp50: | +14.63% | |
| Price / MAexp100: | +23.38% |
News
The last news published on VALLOUREC at the time of the generation of this analysis was as follows:
- Hilco Global Announces Sale of All Assets at Vallourec Deutschland GmbH
- Hilco Global Announces Sale of All Assets at Vallourec Deutschland GmbH
- Vallourec: Disclosure of trading in own shares on 19 May 2020
- Vallourec: Monthly information relating to the total number of voting rights and shares comprising the share capital
- Vallourec launches a reverse stock split
About author
Online


Add a comment
Comments
0 comments on the analysis VALLOUREC - Daily