| Open: | 2.66 |
| Change: | +0.17 |
| Volume: | 4,259 |
| Low: | 2.66 |
| High: | 2.84 |
| High / Low range: | 0.18 |
| Type: | Stocks |
| Ticker: | VK |
| ISIN: | FR0013506730 |
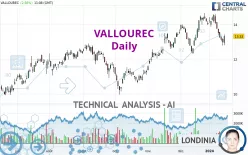
VALLOUREC - Daily - Technical analysis published on 01/16/2024 (GMT)
- 171
- 0
- 01/16/2024 - 11:25
Click here for a new analysis!
- Timeframe : Daily
- - Analysis generated on 01/16/2024 - 11:25
- Status : TARGET REACHED

Summary of the analysis

Additional analysis
Quotes
The VALLOUREC price is 13.330 EUR. The price registered an increase of +2.58% on the session with the lowest point at 12.810 EUR and the highest point at 13.440 EUR. The deviation from the price is +4.06% for the low point and -0.82% for the high point.The Central Gaps scanner detects a bearish opening marking the presence of sellers ahead of buyers at the opening but not sufficiently marked to allow the price to register a quotation gap.
Bearish opening
Type : Bearish
Timeframe : Openning
So that you have an overall view of the price change, here is a table showing the variations over several periods:
Near a new LOW record (1st january)
Type : Bearish
Timeframe : Weekly
Near a new LOW record (1 month)
Type : Bearish
Timeframe : Weekly
Technical
Technical analysis of this Daily chart of VALLOUREC indicates that the overall trend is bullish. 75.00% of the signals given by moving averages are bullish. Caution: the neutral signals currently given by the short-term moving averages indicate that this bullish trend is showing signs of running out of steam. The Central Indicators scanner detects a bullish signal on moving averages that could impact this trend:
Bullish price crossover with Moving Average 50
Type : Bullish
Timeframe : Daily
On the 18 technical indicators analysed, 5 are bullish, 5 are neutral and 8 are bearish. Caution: the Central Indicators scanner currently detects an excess:
CCI indicator is oversold : under -100
Type : Neutral
Timeframe : Daily
Pivot points : price is over resistance 1
Type : Neutral
Timeframe : Daily
MACD indicator is back under 0
Type : Bearish
Timeframe : Daily
An analysis of the price chart with the Central Patterns scanner (detector of chart patterns and resistances and supports) shows several results that can have an impact on the price change:
Near horizontal resistance
Type : Bearish
Timeframe : Daily
Near support of channel
Type : Bullish
Timeframe : Daily
The presence of a bullish Japanese candlestick pattern detected by Central Candlesticks that could cause a very short term rebound was also detected:
Bullish engulfing lines
Type : Bullish
Timeframe : Daily
| S3 | S2 | S1 | Price | R1 | R2 | R3 | |
|---|---|---|---|---|---|---|---|
| ProTrendLines | 12.007 | 12.780 | 13.300 | 13.330 | 13.969 | 14.565 | 16.072 |
| Change (%) | -9.92% | -4.13% | -0.23% | - | +4.79% | +9.26% | +20.57% |
| Change | -1.323 | -0.550 | -0.030 | - | +0.639 | +1.235 | +2.742 |
| Level | Minor | Major | Intermediate | - | Major | Major | Minor |
Attention could also be paid to pivot points to set price objectives:
| Pivot points | S3 | S2 | S1 | PP | R1 | R2 | R3 |
|---|---|---|---|---|---|---|---|
| Standard | 12.345 | 12.565 | 12.780 | 13.000 | 13.215 | 13.435 | 13.650 |
| Camarilla | 12.875 | 12.915 | 12.955 | 12.995 | 13.035 | 13.075 | 13.115 |
| Woodie | 12.343 | 12.564 | 12.778 | 12.999 | 13.213 | 13.434 | 13.648 |
| Fibonacci | 12.565 | 12.731 | 12.834 | 13.000 | 13.166 | 13.269 | 13.435 |
| Pivot points | S3 | S2 | S1 | PP | R1 | R2 | R3 |
|---|---|---|---|---|---|---|---|
| Standard | 11.037 | 12.038 | 12.587 | 13.588 | 14.137 | 15.138 | 15.687 |
| Camarilla | 12.709 | 12.851 | 12.993 | 13.135 | 13.277 | 13.419 | 13.561 |
| Woodie | 10.810 | 11.925 | 12.360 | 13.475 | 13.910 | 15.025 | 15.460 |
| Fibonacci | 12.038 | 12.630 | 12.996 | 13.588 | 14.180 | 14.546 | 15.138 |
| Pivot points | S3 | S2 | S1 | PP | R1 | R2 | R3 |
|---|---|---|---|---|---|---|---|
| Standard | 10.315 | 11.315 | 12.670 | 13.670 | 15.025 | 16.025 | 17.380 |
| Camarilla | 13.377 | 13.593 | 13.809 | 14.025 | 14.241 | 14.457 | 14.673 |
| Woodie | 10.493 | 11.404 | 12.848 | 13.759 | 15.203 | 16.114 | 17.558 |
| Fibonacci | 11.315 | 12.215 | 12.770 | 13.670 | 14.570 | 15.125 | 16.025 |
Numerical data
The following is the status of technical indicators and moving averages registered at the time this technical analysis was created:
| RSI (14): | 45.56 | |
| MACD (12,26,9): | 0.0000 | |
| Directional Movement: | -6.442 | |
| AROON (14): | -85.714 | |
| DEMA (21): | 13.739 | |
| Parabolic SAR (0,02-0,02-0,2): | 14.360 | |
| Elder Ray (13): | -0.486 | |
| Super Trend (3,10): | 14.119 | |
| Zig ZAG (10): | 13.330 | |
| VORTEX (21): | 1.0140 | |
| Stochastique (14,3,5): | 15.29 | |
| TEMA (21): | 13.450 | |
| Williams %R (14): | -71.09 | |
| Chande Momentum Oscillator (20): | -0.865 | |
| Repulse (5,40,3): | 0.7810 | |
| ROCnROLL: | -1 | |
| TRIX (15,9): | 0.2010 | |
| Courbe Coppock: | 7.52 |
| MA7: | 13.446 | |
| MA20: | 13.917 | |
| MA50: | 13.327 | |
| MA100: | 12.487 | |
| MAexp7: | 13.435 | |
| MAexp20: | 13.640 | |
| MAexp50: | 13.264 | |
| MAexp100: | 12.757 | |
| Price / MA7: | -0.86% | |
| Price / MA20: | -4.22% | |
| Price / MA50: | +0.02% | |
| Price / MA100: | +6.75% | |
| Price / MAexp7: | -0.78% | |
| Price / MAexp20: | -2.27% | |
| Price / MAexp50: | +0.50% | |
| Price / MAexp100: | +4.49% |
News
The latest news and videos published on VALLOUREC at the time of the analysis were as follows:
- 04/26/2023 - 19:17 Hilco Global Announces Sale of All Assets at Vallourec Deutschland GmbH
- 04/26/2023 - 19:05 Hilco Global Announces Sale of All Assets at Vallourec Deutschland GmbH
- 05/25/2020 - 16:00 Vallourec: Disclosure of trading in own shares on 19 May 2020
- 05/15/2020 - 16:00 Vallourec: Monthly information relating to the total number of voting rights and shares comprising the share capital
- 04/23/2020 - 06:15 Vallourec launches a reverse stock split
About author
Online


Add a comment
Comments
0 comments on the analysis VALLOUREC - Daily