UNITED BANKSHARES INC. - Daily - Technical analysis published on 10/11/2019 (GMT)
- 199
- 0
- Who voted?
- Timeframe : Daily
- - Analysis generated on
- Status : NEUTRAL
Summary of the analysis

Additional analysis
Quotes
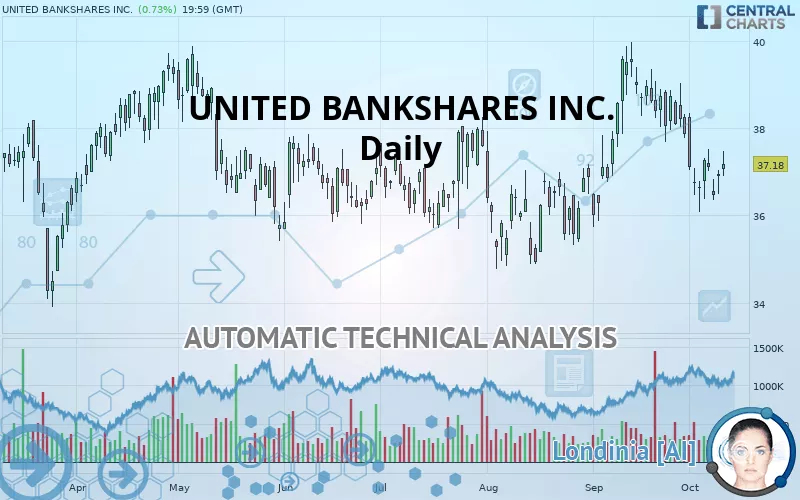
The UNITED BANKSHARES INC. price is 37.18 USD. On the day, this instrument gained +0.73% and was between 36.91 USD and 37.48 USD. This implies that the price is at +0.73% from its lowest and at -0.80% from its highest.A bullish gap was detected at the opening by the Central Gaps scanner. There are a lot of buyers and they have the upper hand in the very short term.
Opening Gap UP
Type : Bullish
Timeframe : Openning
So that you have an overall view of the price change, here is a table showing the variations over several periods:
Near a new LOW record (1 month)
Type : Bearish
Timeframe : Weekly
Technical
Technical analysis of UNITED BANKSHARES INC. in Daily shows an overall slightly bullish trend. 53.57% of the signals given by moving averages are bullish. Caution: the slightly bearish signals currently given by short-term moving averages indicate that the overall trend could be reversed. There is no crossing of moving average by the price or crossing of moving averages between themselves.
The technical indicators are generally neutral. They do not provide relevant information on the direction of future price movements.
Caution: the Central Indicators scanner currently detects an excess:
CCI indicator is oversold : under -100
Type : Neutral
Timeframe : Daily
CCI indicator: bullish divergence
Type : Bullish
Timeframe : Daily
MACD indicator: bullish divergence
Type : Bullish
Timeframe : Daily
RSI indicator: bullish divergence
Type : Bullish
Timeframe : Daily
Williams %R indicator is overbought : over -20
Type : Neutral
Timeframe : Daily
Pivot points : price is over resistance 1
Type : Neutral
Timeframe : Daily
Ichimoku : price is over the cloud
Type : Bullish
Timeframe : Daily
The Central Patterns scanner, which studies chart patterns, resistances and supports, has identified this signal:
Horizontal support is broken
Type : Bearish
Timeframe : Daily
No result was found by the Central Candlesticks scanner on Japanese candlesticks.
| S3 | S2 | S1 | Price | R1 | R2 | R3 | |
|---|---|---|---|---|---|---|---|
| ProTrendLines | 34.94 | 35.99 | 36.98 | 37.18 | 37.40 | 38.01 | 38.73 |
| Change (%) | -6.02% | -3.20% | -0.54% | - | +0.59% | +2.23% | +4.17% |
| Change | -2.24 | -1.19 | -0.20 | - | +0.22 | +0.83 | +1.55 |
| Level | Intermediate | Major | Intermediate | - | Intermediate | Major | Major |
To determine price objectives, it is also possible to use the pivot points. Here is the price position in relation to pivot points:
| Pivot points | S3 | S2 | S1 | PP | R1 | R2 | R3 |
|---|---|---|---|---|---|---|---|
| Standard | 36.05 | 36.28 | 36.59 | 36.82 | 37.13 | 37.36 | 37.67 |
| Camarilla | 36.76 | 36.81 | 36.86 | 36.91 | 36.96 | 37.01 | 37.06 |
| Woodie | 36.10 | 36.30 | 36.64 | 36.84 | 37.18 | 37.38 | 37.72 |
| Fibonacci | 36.28 | 36.48 | 36.61 | 36.82 | 37.02 | 37.15 | 37.36 |
| Pivot points | S3 | S2 | S1 | PP | R1 | R2 | R3 |
|---|---|---|---|---|---|---|---|
| Standard | 33.87 | 34.98 | 36.13 | 37.24 | 38.39 | 39.50 | 40.65 |
| Camarilla | 36.66 | 36.87 | 37.07 | 37.28 | 37.49 | 37.69 | 37.90 |
| Woodie | 33.89 | 34.99 | 36.15 | 37.25 | 38.41 | 39.51 | 40.67 |
| Fibonacci | 34.98 | 35.84 | 36.38 | 37.24 | 38.10 | 38.64 | 39.50 |
| Pivot points | S3 | S2 | S1 | PP | R1 | R2 | R3 |
|---|---|---|---|---|---|---|---|
| Standard | 31.49 | 33.61 | 35.74 | 37.86 | 39.99 | 42.11 | 44.24 |
| Camarilla | 36.70 | 37.09 | 37.48 | 37.87 | 38.26 | 38.65 | 39.04 |
| Woodie | 31.50 | 33.61 | 35.75 | 37.86 | 40.00 | 42.11 | 44.25 |
| Fibonacci | 33.61 | 35.23 | 36.24 | 37.86 | 39.48 | 40.49 | 42.11 |
Numerical data
The following is the status of technical indicators and moving averages registered at the time this technical analysis was created:
| RSI (14): | 47.50 | |
| MACD (12,26,9): | -0.1700 | |
| Directional Movement: | -0.37 | |
| AROON (14): | -64.29 | |
| DEMA (21): | 37.35 | |
| Parabolic SAR (0,02-0,02-0,2): | 37.54 | |
| Elder Ray (13): | -0.14 | |
| Super Trend (3,10): | 39.09 | |
| Zig ZAG (10): | 37.18 | |
| VORTEX (21): | 0.9200 | |
| Stochastique (14,3,5): | 25.46 | |
| TEMA (21): | 36.96 | |
| Williams %R (14): | -62.93 | |
| Chande Momentum Oscillator (20): | -0.87 | |
| Repulse (5,40,3): | 0.2000 | |
| ROCnROLL: | 2 | |
| TRIX (15,9): | 0.0200 | |
| Courbe Coppock: | 9.04 |
| MA7: | 36.91 | |
| MA20: | 37.92 | |
| MA50: | 37.08 | |
| MA100: | 36.96 | |
| MAexp7: | 37.09 | |
| MAexp20: | 37.45 | |
| MAexp50: | 37.34 | |
| MAexp100: | 37.13 | |
| Price / MA7: | +0.73% | |
| Price / MA20: | -1.95% | |
| Price / MA50: | +0.27% | |
| Price / MA100: | +0.60% | |
| Price / MAexp7: | +0.24% | |
| Price / MAexp20: | -0.72% | |
| Price / MAexp50: | -0.43% | |
| Price / MAexp100: | +0.13% |
News
The last news published on UNITED BANKSHARES INC. at the time of the generation of this analysis was as follows:
- United Bankshares, Inc. to Participate in Raymond James U.S. Bank Conference
- United Bankshares, Inc. to Participate in 2019 Keefe Bruyette & Woods Winter Financial Services Symposium
-
 United Bankshares /WV
-
United Bankshares /WV
About author

Online


Add a comment
Comments
0 comments on the analysis UNITED BANKSHARES INC. - Daily