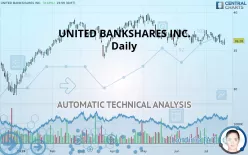
UNITED BANKSHARES INC. - Daily - Technical analysis published on 07/19/2019 (GMT)
- 245
- 0
- Who voted?
Click here for a new analysis!
- Timeframe : Daily
- - Analysis generated on
- Status : TARGET REACHED

Summary of the analysis

Additional analysis
Quotes
UNITED BANKSHARES INC. rating 36.28 USD. The price registered an increase of +0.69% on the session and was between 35.72 USD and 36.55 USD. This implies that the price is at +1.57% from its lowest and at -0.74% from its highest.The Central Gaps scanner detects a bullish opening marking the presence of sellers ahead of buyers at the opening but not sufficiently marked to allow the price to register a quotation gap.
Bearish opening
Type : Bearish
Timeframe : Openning
So that you have an overall view of the price change, here is a table showing the variations over several periods:
Technical
Technical analysis of UNITED BANKSHARES INC. in Daily shows a overall strongly bearish trend. 89.29% of the signals given by moving averages are bearish. The overall trend is supported by the strong bearish signals from short-term moving averages. The Central Indicators scanner does not detect any result on moving averages that would impact this trend.
In fact, of the 18 technical indicators analysed by Central Analyzer, 4 are bullish, 7 are neutral and 7 are bearish. Caution: the Central Indicators scanner currently detects an excess:
CCI indicator is oversold : under -100
Type : Neutral
Timeframe : Daily
Williams %R indicator is oversold : under -80
Type : Neutral
Timeframe : Daily
Aroon indicator bearish trend
Type : Bearish
Timeframe : Daily
An analysis of the price chart with the Central Patterns scanner (detector of chart patterns and resistances and supports) shows several results that can have an impact on the price change:
Horizontal resistance is broken
Type : Bullish
Timeframe : Daily
Support of channel is broken
Type : Bearish
Timeframe : Daily
Support of triangle is broken
Type : Bearish
Timeframe : Daily
There is also a Japanese candlestick pattern detected by Central Candlesticks that could mark the end of the current short-term trend:
Doji
Type : Neutral
Timeframe : Daily
| S3 | S2 | S1 | Price | R1 | R2 | R3 | |
|---|---|---|---|---|---|---|---|
| ProTrendLines | 31.83 | 33.99 | 36.17 | 36.28 | 37.74 | 38.70 | 39.52 |
| Change (%) | -12.27% | -6.31% | -0.30% | - | +4.02% | +6.67% | +8.93% |
| Change | -4.45 | -2.29 | -0.11 | - | +1.46 | +2.42 | +3.24 |
| Level | Major | Intermediate | Major | - | Major | Intermediate | Major |
Pivot points can also be used to set your price objectives. Here is the price situation in relation to pivot points:
| Pivot points | S3 | S2 | S1 | PP | R1 | R2 | R3 |
|---|---|---|---|---|---|---|---|
| Standard | 35.17 | 35.44 | 35.74 | 36.01 | 36.31 | 36.58 | 36.88 |
| Camarilla | 35.87 | 35.93 | 35.98 | 36.03 | 36.08 | 36.14 | 36.19 |
| Woodie | 35.18 | 35.45 | 35.75 | 36.02 | 36.32 | 36.59 | 36.89 |
| Fibonacci | 35.44 | 35.66 | 35.80 | 36.01 | 36.23 | 36.37 | 36.58 |
| Pivot points | S3 | S2 | S1 | PP | R1 | R2 | R3 |
|---|---|---|---|---|---|---|---|
| Standard | 35.07 | 35.56 | 36.27 | 36.76 | 37.47 | 37.96 | 38.67 |
| Camarilla | 36.66 | 36.77 | 36.88 | 36.99 | 37.10 | 37.21 | 37.32 |
| Woodie | 35.19 | 35.62 | 36.39 | 36.82 | 37.59 | 38.02 | 38.79 |
| Fibonacci | 35.56 | 36.02 | 36.30 | 36.76 | 37.22 | 37.50 | 37.96 |
| Pivot points | S3 | S2 | S1 | PP | R1 | R2 | R3 |
|---|---|---|---|---|---|---|---|
| Standard | 33.70 | 34.69 | 35.89 | 36.88 | 38.08 | 39.07 | 40.27 |
| Camarilla | 36.49 | 36.69 | 36.89 | 37.09 | 37.29 | 37.49 | 37.69 |
| Woodie | 33.81 | 34.74 | 36.00 | 36.93 | 38.19 | 39.12 | 40.38 |
| Fibonacci | 34.69 | 35.53 | 36.04 | 36.88 | 37.72 | 38.23 | 39.07 |
Numerical data
The following are the details of the technical indicators and moving averages that were collected to generate this technical analysis:
| RSI (14): | 46.05 | |
| MACD (12,26,9): | -0.1900 | |
| Directional Movement: | -2.85 | |
| AROON (14): | -78.57 | |
| DEMA (21): | 36.32 | |
| Parabolic SAR (0,02-0,02-0,2): | 37.27 | |
| Elder Ray (13): | -0.33 | |
| Super Trend (3,10): | 38.05 | |
| Zig ZAG (10): | 36.28 | |
| VORTEX (21): | 0.9500 | |
| Stochastique (14,3,5): | 21.65 | |
| TEMA (21): | 36.30 | |
| Williams %R (14): | -71.13 | |
| Chande Momentum Oscillator (20): | -0.86 | |
| Repulse (5,40,3): | 0.9200 | |
| ROCnROLL: | 2 | |
| TRIX (15,9): | -0.0500 | |
| Courbe Coppock: | 1.23 |
| MA7: | 36.33 | |
| MA20: | 36.57 | |
| MA50: | 36.88 | |
| MA100: | 37.31 | |
| MAexp7: | 36.34 | |
| MAexp20: | 36.56 | |
| MAexp50: | 36.85 | |
| MAexp100: | 36.83 | |
| Price / MA7: | -0.14% | |
| Price / MA20: | -0.79% | |
| Price / MA50: | -1.63% | |
| Price / MA100: | -2.76% | |
| Price / MAexp7: | -0.17% | |
| Price / MAexp20: | -0.77% | |
| Price / MAexp50: | -1.55% | |
| Price / MAexp100: | -1.49% |
News
The last news published on UNITED BANKSHARES INC. at the time of the generation of this analysis was as follows:
- United Bankshares, Inc. to Participate in 2019 Keefe Bruyette & Woods Winter Financial Services Symposium
-
 United Bankshares /WV
-
United Bankshares /WV
About author

Online


Add a comment
Comments
0 comments on the analysis UNITED BANKSHARES INC. - Daily