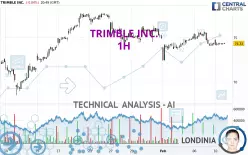
TRIMBLE INC. - 1H - Technical analysis published on 02/10/2025 (GMT)
- 115
- 0
Click here for a new analysis!
- Timeframe : 1H
- - Analysis generated on
- Status : TARGET REACHED

Summary of the analysis

Additional analysis
Quotes
The TRIMBLE INC. price is 74.33 USD. The price registered a decrease of -0.04% on the session and was between 74.11 USD and 74.76 USD. This implies that the price is at +0.30% from its lowest and at -0.58% from its highest.A bullish opening was detected by the Central Gaps scanner. Buyers are trying to impose a bullish momentum in the very short term.
Bullish opening
Type : Bullish
Timeframe : Openning
So that you have an overall view of the price change, here is a table showing the variations over several periods:
Near a new HIGH record (1 year)
Type : Bullish
Timeframe : Weekly
Near a new HIGH record (1st january)
Type : Bullish
Timeframe : Weekly
Near a new HIGH record (1 month)
Type : Bullish
Timeframe : Weekly
Technical
Technical analysis of this 1H chart of TRIMBLE INC. indicates that the overall trend is strongly bearish. The signals given by moving averages are 85.71% bearish. This strong bearish trend is confirmed by the strong signals currently being given by short-term moving averages. There is no crossing of moving average by the price or crossing of moving averages between themselves.
Technical indicators are slightly bearish. There is therefore considerable uncertainty about the continuation of the decline.
But beware of excesses. The Central Indicators scanner currently detects this:
Williams %R indicator is oversold : under -80
Type : Neutral
Timeframe : 1 hour
The Central Patterns scanner, which studies chart patterns, resistances and supports, has identified these signals:
Near horizontal support
Type : Bullish
Timeframe : 1 hour
Near support of channel
Type : Bullish
Timeframe : 1 hour
The Central Candlesticks scanner currently notes the presence of this pattern in Japanese candlesticks that could mark the end of the short-term trend currently underway:
White gravestone / inverted hammer
Type : Neutral
Timeframe : 1 hour
| S3 | S2 | S1 | Price | R1 | R2 | R3 | |
|---|---|---|---|---|---|---|---|
| ProTrendLines | 69.70 | 71.06 | 73.16 | 74.33 | 74.35 | 76.35 | 77.49 |
| Change (%) | -6.23% | -4.40% | -1.57% | - | +0.03% | +2.72% | +4.25% |
| Change | -4.63 | -3.27 | -1.17 | - | +0.02 | +2.02 | +3.16 |
| Level | Major | Minor | Intermediate | - | Major | Intermediate | Major |
Pivot points can also be used to set your price objectives. Here is the price situation in relation to pivot points:
| Pivot points | S3 | S2 | S1 | PP | R1 | R2 | R3 |
|---|---|---|---|---|---|---|---|
| Standard | 72.11 | 73.08 | 73.72 | 74.69 | 75.33 | 76.30 | 76.94 |
| Camarilla | 73.92 | 74.07 | 74.21 | 74.36 | 74.51 | 74.66 | 74.80 |
| Woodie | 71.95 | 73.00 | 73.56 | 74.61 | 75.17 | 76.22 | 76.78 |
| Fibonacci | 73.08 | 73.70 | 74.08 | 74.69 | 75.31 | 75.69 | 76.30 |
| Pivot points | S3 | S2 | S1 | PP | R1 | R2 | R3 |
|---|---|---|---|---|---|---|---|
| Standard | 69.34 | 70.87 | 72.61 | 74.14 | 75.88 | 77.41 | 79.15 |
| Camarilla | 73.46 | 73.76 | 74.06 | 74.36 | 74.66 | 74.96 | 75.26 |
| Woodie | 69.46 | 70.92 | 72.73 | 74.19 | 76.00 | 77.46 | 79.27 |
| Fibonacci | 70.87 | 72.12 | 72.89 | 74.14 | 75.39 | 76.16 | 77.41 |
| Pivot points | S3 | S2 | S1 | PP | R1 | R2 | R3 |
|---|---|---|---|---|---|---|---|
| Standard | 60.42 | 64.45 | 69.71 | 73.74 | 79.00 | 83.03 | 88.29 |
| Camarilla | 72.41 | 73.26 | 74.11 | 74.96 | 75.81 | 76.66 | 77.52 |
| Woodie | 61.03 | 64.76 | 70.32 | 74.05 | 79.61 | 83.34 | 88.90 |
| Fibonacci | 64.45 | 68.00 | 70.20 | 73.74 | 77.29 | 79.49 | 83.03 |
Numerical data
The following is the status of technical indicators and moving averages registered at the time this technical analysis was created:
| RSI (14): | 44.20 | |
| MACD (12,26,9): | -0.1400 | |
| Directional Movement: | 0.85 | |
| AROON (14): | -21.43 | |
| DEMA (21): | 74.33 | |
| Parabolic SAR (0,02-0,02-0,2): | 75.37 | |
| Elder Ray (13): | -0.07 | |
| Super Trend (3,10): | 74.11 | |
| Zig ZAG (10): | 74.31 | |
| VORTEX (21): | 0.9300 | |
| Stochastique (14,3,5): | 15.22 | |
| TEMA (21): | 74.26 | |
| Williams %R (14): | -83.85 | |
| Chande Momentum Oscillator (20): | -0.43 | |
| Repulse (5,40,3): | -0.0700 | |
| ROCnROLL: | 2 | |
| TRIX (15,9): | -0.0200 | |
| Courbe Coppock: | 2.25 |
| MA7: | 74.65 | |
| MA20: | 74.80 | |
| MA50: | 73.43 | |
| MA100: | 68.69 | |
| MAexp7: | 74.33 | |
| MAexp20: | 74.49 | |
| MAexp50: | 74.70 | |
| MAexp100: | 74.66 | |
| Price / MA7: | -0.43% | |
| Price / MA20: | -0.63% | |
| Price / MA50: | +1.23% | |
| Price / MA100: | +8.21% | |
| Price / MAexp7: | -0% | |
| Price / MAexp20: | -0.21% | |
| Price / MAexp50: | -0.50% | |
| Price / MAexp100: | -0.44% |
News
The last news published on TRIMBLE INC. at the time of the generation of this analysis was as follows:
- Investor Network: Trimble Inc. to Host Earnings Call
- Investor Network: Trimble Inc. to Host Earnings Call
About author
Online


Add a comment
Comments
0 comments on the analysis TRIMBLE INC. - 1H