TRIMBLE INC. - Daily - Technical analysis published on 02/08/2025 (GMT)
- 100
- 0
- Timeframe : Daily
- - Analysis generated on
- Status : IN PROGRESS...

Summary of the analysis

Additional analysis
Quotes
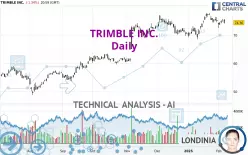
TRIMBLE INC. rating 74.36 USD. On the day, this instrument lost -1.34% with the lowest point at 74.05 USD and the highest point at 75.66 USD. The deviation from the price is +0.42% for the low point and -1.72% for the high point.Here is a more detailed summary of the historical variations registered by TRIMBLE INC.:
Near a new HIGH record (1 year)
Type : Bullish
Timeframe : Weekly
Near a new HIGH record (1st january)
Type : Bullish
Timeframe : Weekly
Near a new HIGH record (1 month)
Type : Bullish
Timeframe : Weekly
Technical
Technical analysis of this Daily chart of TRIMBLE INC. indicates that the overall trend is bullish. The signals given by moving averages are 75.00% bullish. This bullish trend could slow down given the neutral signals currently being given by short-term moving averages. The Central Indicators market scanner is currently detecting a bearish signal that could impact this trend:
Bearish price crossover with Moving Average 20
Type : Bearish
Timeframe : Daily
The probability of a further decline is low given the direction of the technical indicators.
Central Indicators, the scanner specialised in technical indicators, has identified these signals:
Pivot points : price is under support 1
Type : Neutral
Timeframe : Daily
Williams %R indicator is back under -50
Type : Bearish
Timeframe : Daily
The Central Patterns scanner, which studies chart patterns, resistances and supports, has identified this signal:
Near resistance of channel
Type : Bearish
Timeframe : Daily
The Central Candlesticks scanner which studies Japanese candlesticks did not detect anything.
| S3 | S2 | S1 | Price | R1 | R2 | R3 | |
|---|---|---|---|---|---|---|---|
| ProTrendLines | 64.69 | 69.70 | 74.35 | 74.36 | 77.49 | 80.38 | 89.07 |
| Change (%) | -13.00% | -6.27% | -0.01% | - | +4.21% | +8.10% | +19.78% |
| Change | -9.67 | -4.66 | -0.01 | - | +3.13 | +6.02 | +14.71 |
| Level | Major | Major | Major | - | Major | Minor | Minor |
Pivot points can also be used to set your price objectives. Here is the price situation in relation to pivot points:
| Pivot points | S3 | S2 | S1 | PP | R1 | R2 | R3 |
|---|---|---|---|---|---|---|---|
| Standard | 72.11 | 73.08 | 73.72 | 74.69 | 75.33 | 76.30 | 76.94 |
| Camarilla | 73.92 | 74.07 | 74.21 | 74.36 | 74.51 | 74.66 | 74.80 |
| Woodie | 71.95 | 73.00 | 73.56 | 74.61 | 75.17 | 76.22 | 76.78 |
| Fibonacci | 73.08 | 73.70 | 74.08 | 74.69 | 75.31 | 75.69 | 76.30 |
| Pivot points | S3 | S2 | S1 | PP | R1 | R2 | R3 |
|---|---|---|---|---|---|---|---|
| Standard | 69.34 | 70.87 | 72.61 | 74.14 | 75.88 | 77.41 | 79.15 |
| Camarilla | 73.46 | 73.76 | 74.06 | 74.36 | 74.66 | 74.96 | 75.26 |
| Woodie | 69.46 | 70.92 | 72.73 | 74.19 | 76.00 | 77.46 | 79.27 |
| Fibonacci | 70.87 | 72.12 | 72.89 | 74.14 | 75.39 | 76.16 | 77.41 |
| Pivot points | S3 | S2 | S1 | PP | R1 | R2 | R3 |
|---|---|---|---|---|---|---|---|
| Standard | 60.42 | 64.45 | 69.71 | 73.74 | 79.00 | 83.03 | 88.29 |
| Camarilla | 72.41 | 73.26 | 74.11 | 74.96 | 75.81 | 76.66 | 77.52 |
| Woodie | 61.03 | 64.76 | 70.32 | 74.05 | 79.61 | 83.34 | 88.90 |
| Fibonacci | 64.45 | 68.00 | 70.20 | 73.74 | 77.29 | 79.49 | 83.03 |
Numerical data
The following are the details of the technical indicators and moving averages that were collected to generate this technical analysis:
| RSI (14): | 51.35 | |
| MACD (12,26,9): | 0.6700 | |
| Directional Movement: | -1.28 | |
| AROON (14): | -42.86 | |
| DEMA (21): | 75.45 | |
| Parabolic SAR (0,02-0,02-0,2): | 77.36 | |
| Elder Ray (13): | 0.07 | |
| Super Trend (3,10): | 72.91 | |
| Zig ZAG (10): | 74.36 | |
| VORTEX (21): | 1.0200 | |
| Stochastique (14,3,5): | 47.24 | |
| TEMA (21): | 75.29 | |
| Williams %R (14): | -63.39 | |
| Chande Momentum Oscillator (20): | -3.04 | |
| Repulse (5,40,3): | -0.6500 | |
| ROCnROLL: | -1 | |
| TRIX (15,9): | 0.1700 | |
| Courbe Coppock: | 3.09 |
| MA7: | 74.80 | |
| MA20: | 74.60 | |
| MA50: | 73.40 | |
| MA100: | 68.53 | |
| MAexp7: | 74.86 | |
| MAexp20: | 74.48 | |
| MAexp50: | 72.60 | |
| MAexp100: | 69.22 | |
| Price / MA7: | -0.59% | |
| Price / MA20: | -0.32% | |
| Price / MA50: | +1.31% | |
| Price / MA100: | +8.51% | |
| Price / MAexp7: | -0.67% | |
| Price / MAexp20: | -0.16% | |
| Price / MAexp50: | +2.42% | |
| Price / MAexp100: | +7.43% |
News
The latest news and videos published on TRIMBLE INC. at the time of the analysis were as follows:
- Investor Network: Trimble Inc. to Host Earnings Call
- Investor Network: Trimble Inc. to Host Earnings Call
About author

Online


Add a comment
Comments
0 comments on the analysis TRIMBLE INC. - Daily