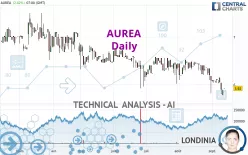
AUREA - Daily - Technical analysis published on 09/13/2023 (GMT)
- 157
- 0
Click here for a new analysis!
- Timeframe : Daily
- - Analysis generated on
- Status : TARGET REACHED

Summary of the analysis

Additional analysis
Quotes
The AUREA price is 5.92 EUR. The price registered an increase of +2.42% on the session and was traded between 5.92 EUR and 5.92 EUR over the period. The price is currently at 0% from its lowest and 0% from its highest.The Central Gaps scanner detects the formation of a bullish gap marking the strong presence of buyers against sellers at the opening. This formed a quotation gap.
Opening Gap UP
Type : Bullish
Timeframe : Openning
So that you have an overall view of the price change, here is a table showing the variations over several periods:
Near a new LOW record (1 year)
Type : Bearish
Timeframe : Weekly
Near a new LOW record (1st january)
Type : Bearish
Timeframe : Weekly
Near a new LOW record (1 month)
Type : Bearish
Timeframe : Weekly
Technical
A technical analysis in Daily of this AUREA chart shows a sharp bearish trend. The signals given by moving averages are 92.86% bearish. This strong bearish trend is confirmed by the strong signals currently being given by short-term moving averages. There is no crossing of moving average by the price or crossing of moving averages between themselves.
In fact, Central Analyzer took into account 18 technical indicators and the result was as follows: 5 are bullish, 1 are neutral and 12 are bearish. Caution: the Central Indicators scanner currently detects an excess:
CCI indicator is oversold : under -100
Type : Neutral
Timeframe : Daily
Previous candle closed under Bollinger bands
Type : Neutral
Timeframe : Daily
CCI indicator: bullish divergence
Type : Bullish
Timeframe : Daily
Pivot points : price is over resistance 1
Type : Neutral
Timeframe : Daily
Pivot points : price is under support 3
Type : Neutral
Timeframe : Weekly
An analysis of the price chart with the Central Patterns scanner (detector of chart patterns and resistances and supports) shows a result that can have an impact on the price change:
Near support of channel
Type : Bullish
Timeframe : Daily
The Central Candlesticks scanner currently notes the presence of this pattern in Japanese candlesticks that could mark the end of the short-term trend currently underway:
Doji
Type : Neutral
Timeframe : Daily
| S3 | S2 | S1 | Price | R1 | R2 | R3 | |
|---|---|---|---|---|---|---|---|
| ProTrendLines | 3.18 | 4.37 | 5.43 | 5.92 | 6.16 | 6.46 | 7.10 |
| Change (%) | -46.28% | -26.18% | -8.28% | - | +4.05% | +9.12% | +19.93% |
| Change | -2.74 | -1.55 | -0.49 | - | +0.24 | +0.54 | +1.18 |
| Level | Major | Major | Intermediate | - | Major | Intermediate | Intermediate |
Attention could also be paid to pivot points to set price objectives:
| Pivot points | S3 | S2 | S1 | PP | R1 | R2 | R3 |
|---|---|---|---|---|---|---|---|
| Standard | 5.62 | 5.70 | 5.74 | 5.82 | 5.86 | 5.94 | 5.98 |
| Camarilla | 5.75 | 5.76 | 5.77 | 5.78 | 5.79 | 5.80 | 5.81 |
| Woodie | 5.60 | 5.69 | 5.72 | 5.81 | 5.84 | 5.93 | 5.96 |
| Fibonacci | 5.70 | 5.75 | 5.77 | 5.82 | 5.87 | 5.89 | 5.94 |
| Pivot points | S3 | S2 | S1 | PP | R1 | R2 | R3 |
|---|---|---|---|---|---|---|---|
| Standard | 5.95 | 5.99 | 6.07 | 6.11 | 6.19 | 6.23 | 6.31 |
| Camarilla | 6.11 | 6.12 | 6.13 | 6.14 | 6.15 | 6.16 | 6.17 |
| Woodie | 5.96 | 6.00 | 6.08 | 6.12 | 6.20 | 6.24 | 6.32 |
| Fibonacci | 5.99 | 6.04 | 6.07 | 6.11 | 6.16 | 6.19 | 6.23 |
| Pivot points | S3 | S2 | S1 | PP | R1 | R2 | R3 |
|---|---|---|---|---|---|---|---|
| Standard | 5.07 | 5.45 | 5.77 | 6.15 | 6.47 | 6.85 | 7.17 |
| Camarilla | 5.91 | 5.97 | 6.04 | 6.10 | 6.16 | 6.23 | 6.29 |
| Woodie | 5.05 | 5.44 | 5.75 | 6.14 | 6.45 | 6.84 | 7.15 |
| Fibonacci | 5.45 | 5.71 | 5.88 | 6.15 | 6.41 | 6.58 | 6.85 |
Numerical data
The following is the status of technical indicators and moving averages registered at the time this technical analysis was created:
| RSI (14): | 38.12 | |
| MACD (12,26,9): | -0.1200 | |
| Directional Movement: | -24.79 | |
| AROON (14): | -92.86 | |
| DEMA (21): | 5.99 | |
| Parabolic SAR (0,02-0,02-0,2): | 6.27 | |
| Elder Ray (13): | -0.14 | |
| Super Trend (3,10): | 6.26 | |
| Zig ZAG (10): | 5.92 | |
| VORTEX (21): | 0.6900 | |
| Stochastique (14,3,5): | 13.08 | |
| TEMA (21): | 5.91 | |
| Williams %R (14): | -77.42 | |
| Chande Momentum Oscillator (20): | -0.44 | |
| Repulse (5,40,3): | -2.0000 | |
| ROCnROLL: | 2 | |
| TRIX (15,9): | -0.1900 | |
| Courbe Coppock: | 11.34 |
| MA7: | 6.00 | |
| MA20: | 6.18 | |
| MA50: | 6.31 | |
| MA100: | 6.43 | |
| MAexp7: | 5.98 | |
| MAexp20: | 6.13 | |
| MAexp50: | 6.28 | |
| MAexp100: | 6.43 | |
| Price / MA7: | -1.33% | |
| Price / MA20: | -4.21% | |
| Price / MA50: | -6.18% | |
| Price / MA100: | -7.93% | |
| Price / MAexp7: | -1.00% | |
| Price / MAexp20: | -3.43% | |
| Price / MAexp50: | -5.73% | |
| Price / MAexp100: | -7.93% |
News
The last news published on AUREA at the time of the generation of this analysis was as follows:
- ReneSola Power and MP Sicily Developments to Co-develop Solar Projects in Italy
- Aurea Announces Intention to Acquire BroadVision
- Informations relatives aux caractéristiques notamment juridiques, financières et comptables d'AUREA
- Aurea : Augmentation de capital liée à l'option de paiement du dividende en actions
- Aurea Lighting Debuts Game-Changing Healthy LED Lighting That Improves Alertness and Productivity Without Sacrificing Energy Efficiency
About author
Online


Add a comment
Comments
0 comments on the analysis AUREA - Daily