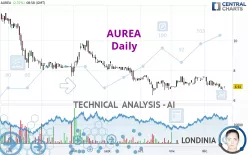
AUREA - Daily - Technical analysis published on 12/20/2022 (GMT)
- 180
- 0
Click here for a new analysis!
- Timeframe : Daily
- - Analysis generated on
- Status : LEVEL MAINTAINED

Summary of the analysis

Additional analysis
Quotes
AUREA rating 6.92 EUR. On the day, this instrument gained +2.37% and was between 6.80 EUR and 6.92 EUR. This implies that the price is at +1.76% from its lowest and at 0% from its highest.A bullish gap was detected at the opening by the Central Gaps scanner. There are a lot of buyers and they have the upper hand in the very short term.
Opening Gap UP
Type : Bullish
Timeframe : Openning
Here is a more detailed summary of the historical variations registered by AUREA:
Near a new LOW record (1 month)
Type : Bearish
Timeframe : Weekly
Technical
A technical analysis in Daily of this AUREA chart shows a sharp bearish trend. The signals given by moving averages are 89.29% bearish. This strong bearish trend is confirmed by the strong signals currently being given by short-term moving averages. There is no crossing of moving average by the price or crossing of moving averages between themselves.
On the 18 technical indicators analysed, 4 are bullish, 2 are neutral and 12 are bearish. Caution: the Central Indicators scanner currently detects an excess:
CCI indicator is oversold : under -100
Type : Neutral
Timeframe : Daily
Pivot points : price is over resistance 1
Type : Neutral
Timeframe : Daily
Price is back over the pivot point
Type : Bullish
Timeframe : Weekly
Central Patterns, the market scanner focusing on chart patterns, resistances and supports found these results:
Near horizontal resistance
Type : Bearish
Timeframe : Daily
Near resistance of channel
Type : Bearish
Timeframe : Daily
No result was found by the Central Candlesticks scanner on Japanese candlesticks.
| S3 | S2 | S1 | Price | R1 | R2 | R3 | |
|---|---|---|---|---|---|---|---|
| ProTrendLines | 3.18 | 4.42 | 5.43 | 6.92 | 7.01 | 7.58 | 8.83 |
| Change (%) | -54.05% | -36.13% | -21.53% | - | +1.30% | +9.54% | +27.60% |
| Change | -3.74 | -2.50 | -1.49 | - | +0.09 | +0.66 | +1.91 |
| Level | Major | Intermediate | Major | - | Major | Intermediate | Intermediate |
Pivot points can also be used to set your price objectives. Here is the price situation in relation to pivot points:
| Pivot points | S3 | S2 | S1 | PP | R1 | R2 | R3 |
|---|---|---|---|---|---|---|---|
| Standard | 6.57 | 6.65 | 6.71 | 6.79 | 6.85 | 6.93 | 6.99 |
| Camarilla | 6.72 | 6.73 | 6.75 | 6.76 | 6.77 | 6.79 | 6.80 |
| Woodie | 6.55 | 6.65 | 6.69 | 6.79 | 6.83 | 6.93 | 6.97 |
| Fibonacci | 6.65 | 6.71 | 6.74 | 6.79 | 6.85 | 6.88 | 6.93 |
| Pivot points | S3 | S2 | S1 | PP | R1 | R2 | R3 |
|---|---|---|---|---|---|---|---|
| Standard | 6.17 | 6.47 | 6.61 | 6.91 | 7.05 | 7.35 | 7.49 |
| Camarilla | 6.64 | 6.68 | 6.72 | 6.76 | 6.80 | 6.84 | 6.88 |
| Woodie | 6.10 | 6.43 | 6.54 | 6.87 | 6.98 | 7.31 | 7.42 |
| Fibonacci | 6.47 | 6.64 | 6.74 | 6.91 | 7.08 | 7.18 | 7.35 |
| Pivot points | S3 | S2 | S1 | PP | R1 | R2 | R3 |
|---|---|---|---|---|---|---|---|
| Standard | 6.29 | 6.55 | 7.07 | 7.33 | 7.85 | 8.11 | 8.63 |
| Camarilla | 7.37 | 7.44 | 7.51 | 7.58 | 7.65 | 7.72 | 7.80 |
| Woodie | 6.41 | 6.62 | 7.19 | 7.40 | 7.97 | 8.18 | 8.75 |
| Fibonacci | 6.55 | 6.85 | 7.04 | 7.33 | 7.63 | 7.82 | 8.11 |
Numerical data
The following is the status of technical indicators and moving averages registered at the time this technical analysis was created:
| RSI (14): | 42.89 | |
| MACD (12,26,9): | -0.1100 | |
| Directional Movement: | -11.77 | |
| AROON (14): | -92.86 | |
| DEMA (21): | 6.96 | |
| Parabolic SAR (0,02-0,02-0,2): | 7.20 | |
| Elder Ray (13): | -0.16 | |
| Super Trend (3,10): | 7.49 | |
| Zig ZAG (10): | 6.92 | |
| VORTEX (21): | 0.9000 | |
| Stochastique (14,3,5): | 8.11 | |
| TEMA (21): | 6.90 | |
| Williams %R (14): | -78.05 | |
| Chande Momentum Oscillator (20): | -0.36 | |
| Repulse (5,40,3): | -1.5100 | |
| ROCnROLL: | 2 | |
| TRIX (15,9): | -0.1000 | |
| Courbe Coppock: | 12.63 |
| MA7: | 6.93 | |
| MA20: | 7.20 | |
| MA50: | 7.14 | |
| MA100: | 7.74 | |
| MAexp7: | 6.93 | |
| MAexp20: | 7.09 | |
| MAexp50: | 7.27 | |
| MAexp100: | 7.68 | |
| Price / MA7: | -0.14% | |
| Price / MA20: | -3.89% | |
| Price / MA50: | -3.08% | |
| Price / MA100: | -10.59% | |
| Price / MAexp7: | -0.14% | |
| Price / MAexp20: | -2.40% | |
| Price / MAexp50: | -4.81% | |
| Price / MAexp100: | -9.90% |
News
Don't forget to follow the news on AUREA. At the time of publication of this analysis, the latest news was as follows:
- ReneSola Power and MP Sicily Developments to Co-develop Solar Projects in Italy
- Aurea Announces Intention to Acquire BroadVision
- Informations relatives aux caractéristiques notamment juridiques, financières et comptables d'AUREA
- Aurea : Augmentation de capital liée à l'option de paiement du dividende en actions
- Aurea Lighting Debuts Game-Changing Healthy LED Lighting That Improves Alertness and Productivity Without Sacrificing Energy Efficiency
About author
Online


Add a comment
Comments
0 comments on the analysis AUREA - Daily