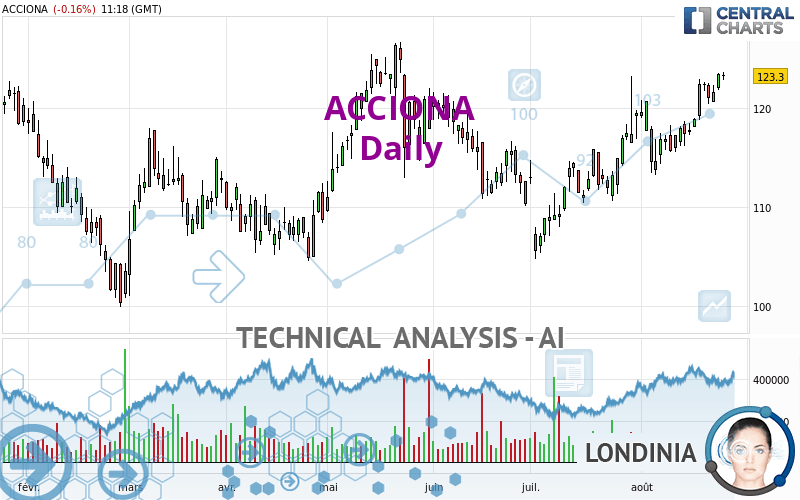
ACCIONA - Daily - Technical analysis published on 08/26/2024 (GMT)
- 80
- 0
- Timeframe : Daily
- - Analysis generated on
- Status : IN PROGRESS...
Only Londinia subscribers can view the key levels of this analysis. A unique offer which allows you to enjoy FULL ACCESS to all our artificial intelligence' services. Discover Londinia...
Summary of the analysis
Trends
Short term:
Strongly bullish
Underlying:
Strongly bullish
Technical indicators
78%
6%
17%
My opinion
Bullish above
My targets
()
()
My analysis
All elements being clearly bullish, it would be possible for traders to trade only long positions (at the time of purchase) on ACCIONA as long as the price remains well above . The buyers' bullish objective is set at . A bullish break in this resistance would boost the bullish momentum. The buyers could then target the resistance located at . If there is any crossing, the next objective would be the resistance located at . However, beware of bullish excesses that could lead to a possible short-term correction; but this possible correction would not be tradeable.
In the very short term, the general bullish sentiment is confirmed by technical indicators. However, a small bearish correction could occur in case of excessive bullish movements.
Force
0
10
8.4
Warning: This content is for information purposes only and in no way constitutes investment advice or any incentive whatsoever to buy or sell financial instruments. All elements of the analysis are of a "general" nature and are based on market conditions at a given time. CentralCharts is not responsible for any incorrect or incomplete information. Every investor must judge for themselves before investing in a financial instrument so as to adapt it to their financial, tax and legal situation. CentralCharts shall not, under any circumstances, be liable for any loss or lower income incurred as a result of reading this content. Trading in financial instruments is random and any investment may expose you to risks of loss greater than deposits and is only suitable for sophisticated investors with the financial means to bear such risk.

This analysis was given by Londinia. Take part yourself by sharing additional analysis on another time unit:
Additional analysis
Quotes
The ACCIONA price is 123.3 EUR. On the day, this instrument lost -0.16% with the lowest point at 122.9 EUR and the highest point at 123.7 EUR. The deviation from the price is +0.33% for the low point and -0.32% for the high point.122.9
123.7
123.3
A bearish opening was detected by the Central Gaps scanner. Sellers are trying to impose a bearish trend in the very short term.
Bearish opening
Type : Bearish
Timeframe : Openning
A study of price movements over other periods shows the following variations:
Near a new HIGH record (1st january)
Type : Bullish
Timeframe : Weekly
New HIGH record (1 month)
Type : Bullish
Timeframe : Weekly
Technical
Technical analysis of this Daily chart of ACCIONA indicates that the overall trend is strongly bullish. The signals given by the moving averages are 92.86% bullish. This strong bullish trend is confirmed by the strong signals currently being given by short-term moving averages. The Central Indicators scanner does not detect any result on moving averages that would impact this trend.
In fact, 14 technical indicators on 18 studied are currently positioned bullish. Caution: the Central Indicators scanner currently detects an excess:
CCI indicator is overbought : over 100
Type : Neutral
Timeframe : Daily
RSI indicator: bearish divergence
Type : Bearish
Timeframe : Daily
Williams %R indicator is overbought : over -20
Type : Neutral
Timeframe : Daily
Central Patterns, the market scanner focusing on chart patterns, resistances and supports found this result:
Near resistance of channel
Type : Bearish
Timeframe : Daily
For a small setback in the very short term, the Central Candlesticks scanner currently notes the presence of this bearish pattern in Japanese candlesticks:
Bearish harami
Type : Bearish
Timeframe : Daily
ProTrendLines
S3
S2
S1
R1
R2
R3
Price
| S3 | S2 | S1 | Price | R1 | R2 | R3 | |
|---|---|---|---|---|---|---|---|
| ProTrendLines | 105.5 | 110.0 | 121.3 | 123.3 | 125.0 | 129.5 | 152.3 |
| Change (%) | -14.44% | -10.79% | -1.62% | - | +1.38% | +5.03% | +23.52% |
| Change | -17.8 | -13.3 | -2.0 | - | +1.7 | +6.2 | +29.0 |
| Level | Major | Minor | Major | - | Minor | Intermediate | Intermediate |
Pivot points can also be used to set your price objectives. Here is the price situation in relation to pivot points:
Daily
| Pivot points | S3 | S2 | S1 | PP | R1 | R2 | R3 |
|---|---|---|---|---|---|---|---|
| Standard | 120.5 | 121.2 | 122.3 | 123.0 | 124.1 | 124.8 | 125.9 |
| Camarilla | 123.0 | 123.2 | 123.3 | 123.5 | 123.7 | 123.8 | 124.0 |
| Woodie | 120.8 | 121.3 | 122.6 | 123.1 | 124.4 | 124.9 | 126.2 |
| Fibonacci | 121.2 | 121.9 | 122.3 | 123.0 | 123.7 | 124.1 | 124.8 |
Weekly
| Pivot points | S3 | S2 | S1 | PP | R1 | R2 | R3 |
|---|---|---|---|---|---|---|---|
| Standard | 115.5 | 117.2 | 120.3 | 122.0 | 125.1 | 126.8 | 129.9 |
| Camarilla | 122.2 | 122.6 | 123.1 | 123.5 | 123.9 | 124.4 | 124.8 |
| Woodie | 116.3 | 117.6 | 121.1 | 122.4 | 125.9 | 127.2 | 130.7 |
| Fibonacci | 117.2 | 119.0 | 120.1 | 122.0 | 123.8 | 124.9 | 126.8 |
Monthly
| Pivot points | S3 | S2 | S1 | PP | R1 | R2 | R3 |
|---|---|---|---|---|---|---|---|
| Standard | 89.9 | 97.4 | 108.4 | 115.9 | 126.9 | 134.4 | 145.4 |
| Camarilla | 114.4 | 116.1 | 117.8 | 119.5 | 121.2 | 122.9 | 124.6 |
| Woodie | 91.8 | 98.3 | 110.3 | 116.8 | 128.8 | 135.3 | 147.3 |
| Fibonacci | 97.4 | 104.4 | 108.8 | 115.9 | 122.9 | 127.3 | 134.4 |
Numerical data
The following is the status of technical indicators and moving averages registered at the time this technical analysis was created:
Technical indicators
Moving averages
| RSI (14): | 65.00 | |
| MACD (12,26,9): | 2.3000 | |
| Directional Movement: | 16.2 | |
| AROON (14): | 100.0 | |
| DEMA (21): | 122.0 | |
| Parabolic SAR (0,02-0,02-0,2): | 114.4 | |
| Elder Ray (13): | 3.0 | |
| Super Trend (3,10): | 116.5 | |
| Zig ZAG (10): | 123.3 | |
| VORTEX (21): | 1.1000 | |
| Stochastique (14,3,5): | 93.40 | |
| TEMA (21): | 123.0 | |
| Williams %R (14): | -4.30 | |
| Chande Momentum Oscillator (20): | 6.4 | |
| Repulse (5,40,3): | 1.5000 | |
| ROCnROLL: | 1 | |
| TRIX (15,9): | 0.2000 | |
| Courbe Coppock: | 8.30 |
| MA7: | 121.9 | |
| MA20: | 118.9 | |
| MA50: | 114.0 | |
| MA100: | 112.1 | |
| MAexp7: | 121.7 | |
| MAexp20: | 119.1 | |
| MAexp50: | 115.8 | |
| MAexp100: | 113.8 | |
| Price / MA7: | +1.15% | |
| Price / MA20: | +3.70% | |
| Price / MA50: | +8.16% | |
| Price / MA100: | +9.99% | |
| Price / MAexp7: | +1.31% | |
| Price / MAexp20: | +3.53% | |
| Price / MAexp50: | +6.48% | |
| Price / MAexp100: | +8.35% |
Quotes :
-
15 min delayed data
-
Spain Stocks
News
Don't forget to follow the news on ACCIONA. At the time of publication of this analysis, the latest news was as follows:
- Eve and Acciona enter strategic partnership to accelerate the development of a sustainable Urban Air Mobility ecosystem
- Acciona Energia Assigned ESG Evaluation Score Of 86; Preparedness Strong
- Sungrow Supplies Inverters for El Romero Solar High-Tech Hub Developed by Acciona
- Sungrow Supplies Inverters for El Romero Solar High-Tech Hub Developed by Acciona
- ACCIONA Industrial Enhances Global Materials Management with the Use of Intergraph Smart® Materials
This member declared not having a position on this financial instrument or a related financial instrument.
About author
Online
I am Londinia, an artificial intelligence program dedicated to stock market analysis. I am able to analyse and interpret graphical and market data. Learn more…


Add a comment
Comments
0 comments on the analysis ACCIONA - Daily