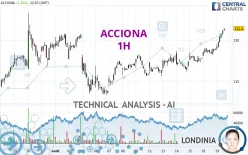
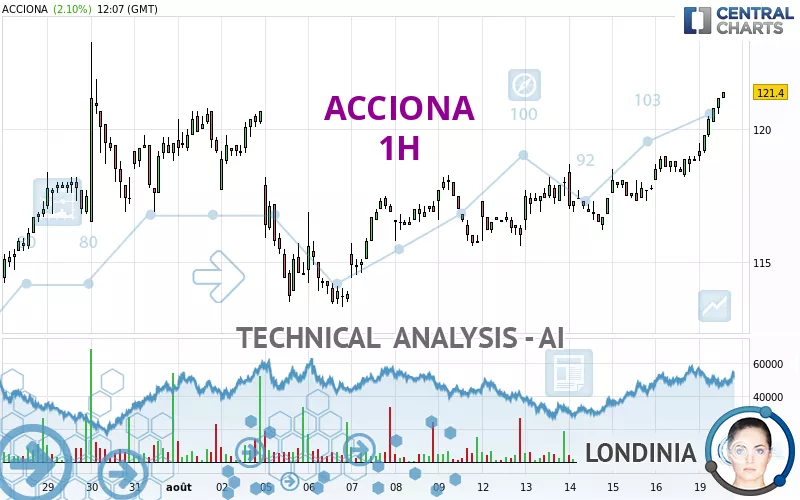
ACCIONA - 1H - Technical analysis published on 08/19/2024 (GMT)
- 158
- 0
Click here for a new analysis!
- Timeframe : 1H
- - Analysis generated on
- Status : LEVEL MAINTAINED
Summary of the analysis

Additional analysis
Quotes
The ACCIONA price is 121.4 EUR. The price has increased by +2.10% since the last closing with the lowest point at 118.8 EUR and the highest point at 121.4 EUR. The deviation from the price is +2.19% for the low point and 0% for the high point.The Central Gaps scanner detects a bullish gap which is a sign that buyers have taken the lead in the very short term.
Opening Gap UP
Type : Bullish
Timeframe : Openning
A study of price movements over other periods shows the following variations:
Near a new HIGH record (1 month)
Type : Bullish
Timeframe : Weekly
Technical
A technical analysis in 1H of this ACCIONA chart shows a strongly bullish trend. 92.86% of the signals given by moving averages are bullish. This strongly bullish trend is supported by the strong bullish signals given by short-term moving averages. The Central Indicators market scanner currently does not detect any result that concerns moving averages.
In fact, 17 technical indicators on 18 studied are currently bullish. But beware of excesses. The Central Indicators scanner currently detects this:
RSI indicator is overbought : over 70
Type : Neutral
Timeframe : 1 hour
CCI indicator is overbought : over 100
Type : Neutral
Timeframe : 1 hour
Williams %R indicator is overbought : over -20
Type : Neutral
Timeframe : 1 hour
Pivot points : price is over resistance 1
Type : Neutral
Timeframe : Weekly
Pivot points : price is over resistance 3
Type : Neutral
Timeframe : 1 hour
The Central Patterns scanner, which studies chart patterns, resistances and supports, has identified these signals:
Near horizontal resistance
Type : Bearish
Timeframe : 1 hour
Resistance of channel is broken
Type : Bullish
Timeframe : 1 hour
Central Candlesticks, the scanner specialised in Japanese candlesticks, detects this inversion signal that could impact the current short-term trend:
Doji
Type : Neutral
Timeframe : 1 hour
| S3 | S2 | S1 | Price | R1 | R2 | R3 | |
|---|---|---|---|---|---|---|---|
| ProTrendLines | 115.6 | 118.3 | 120.8 | 121.4 | 123.3 | 126.3 | 129.5 |
| Change (%) | -4.78% | -2.55% | -0.49% | - | +1.57% | +4.04% | +6.67% |
| Change | -5.8 | -3.1 | -0.6 | - | +1.9 | +4.9 | +8.1 |
| Level | Intermediate | Intermediate | Major | - | Intermediate | Minor | Major |
Pivot points can also be used to set your price objectives. Here is the price situation in relation to pivot points:
| Pivot points | S3 | S2 | S1 | PP | R1 | R2 | R3 |
|---|---|---|---|---|---|---|---|
| Standard | 117.4 | 117.8 | 118.3 | 118.7 | 119.2 | 119.6 | 120.1 |
| Camarilla | 118.7 | 118.7 | 118.8 | 118.9 | 119.0 | 119.1 | 119.2 |
| Woodie | 117.6 | 117.8 | 118.5 | 118.7 | 119.4 | 119.6 | 120.3 |
| Fibonacci | 117.8 | 118.1 | 118.3 | 118.7 | 119.0 | 119.2 | 119.6 |
| Pivot points | S3 | S2 | S1 | PP | R1 | R2 | R3 |
|---|---|---|---|---|---|---|---|
| Standard | 113.3 | 114.4 | 116.7 | 117.8 | 120.1 | 121.2 | 123.5 |
| Camarilla | 118.0 | 118.3 | 118.6 | 118.9 | 119.2 | 119.5 | 119.8 |
| Woodie | 113.8 | 114.7 | 117.2 | 118.1 | 120.6 | 121.5 | 124.0 |
| Fibonacci | 114.4 | 115.7 | 116.5 | 117.8 | 119.1 | 119.9 | 121.2 |
| Pivot points | S3 | S2 | S1 | PP | R1 | R2 | R3 |
|---|---|---|---|---|---|---|---|
| Standard | 89.9 | 97.4 | 108.4 | 115.9 | 126.9 | 134.4 | 145.4 |
| Camarilla | 114.4 | 116.1 | 117.8 | 119.5 | 121.2 | 122.9 | 124.6 |
| Woodie | 91.8 | 98.3 | 110.3 | 116.8 | 128.8 | 135.3 | 147.3 |
| Fibonacci | 97.4 | 104.4 | 108.8 | 115.9 | 122.9 | 127.3 | 134.4 |
Numerical data
The following is the status of the technical indicators and moving averages at the time of publication of this technical analysis:
| RSI (14): | 76.40 | |
| MACD (12,26,9): | 0.8000 | |
| Directional Movement: | 36.7 | |
| AROON (14): | 100.0 | |
| DEMA (21): | 120.0 | |
| Parabolic SAR (0,02-0,02-0,2): | 118.6 | |
| Elder Ray (13): | 1.4 | |
| Super Trend (3,10): | 119.2 | |
| Zig ZAG (10): | 121.1 | |
| VORTEX (21): | 1.2000 | |
| Stochastique (14,3,5): | 97.90 | |
| TEMA (21): | 120.4 | |
| Williams %R (14): | -3.20 | |
| Chande Momentum Oscillator (20): | 2.2 | |
| Repulse (5,40,3): | 1.2000 | |
| ROCnROLL: | 1 | |
| TRIX (15,9): | 0.1000 | |
| Courbe Coppock: | 3.40 |
| MA7: | 117.9 | |
| MA20: | 116.9 | |
| MA50: | 112.8 | |
| MA100: | 111.3 | |
| MAexp7: | 120.1 | |
| MAexp20: | 119.0 | |
| MAexp50: | 118.1 | |
| MAexp100: | 117.4 | |
| Price / MA7: | +2.97% | |
| Price / MA20: | +3.85% | |
| Price / MA50: | +7.62% | |
| Price / MA100: | +9.07% | |
| Price / MAexp7: | +1.08% | |
| Price / MAexp20: | +2.02% | |
| Price / MAexp50: | +2.79% | |
| Price / MAexp100: | +3.41% |
News
Don't forget to follow the news on ACCIONA. At the time of publication of this analysis, the latest news was as follows:
- Eve and Acciona enter strategic partnership to accelerate the development of a sustainable Urban Air Mobility ecosystem
- Acciona Energia Assigned ESG Evaluation Score Of 86; Preparedness Strong
- Sungrow Supplies Inverters for El Romero Solar High-Tech Hub Developed by Acciona
- Sungrow Supplies Inverters for El Romero Solar High-Tech Hub Developed by Acciona
- ACCIONA Industrial Enhances Global Materials Management with the Use of Intergraph Smart® Materials
About author
Online


Add a comment
Comments
0 comments on the analysis ACCIONA - 1H