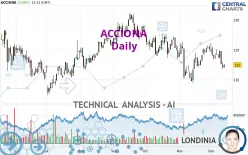
ACCIONA - Daily - Technical analysis published on 12/13/2024 (GMT)
- 113
- 0
Click here for a new analysis!
- Timeframe : Daily
- - Analysis generated on
- Status : TARGET REACHED

Summary of the analysis

Additional analysis
Quotes
ACCIONA rating 115.0 EUR. On the day, this instrument gained +0.88% with the lowest point at 113.8 EUR and the highest point at 115.1 EUR. The deviation from the price is +1.05% for the low point and -0.09% for the high point.So that you have an overall view of the price change, here is a table showing the variations over several periods:
Near a new LOW record (1 month)
Type : Bearish
Timeframe : Weekly
Technical
A technical analysis in Daily of this ACCIONA chart shows a sharp bearish trend. 92.86% of the signals given by moving averages are bearish. This strongly bearish trend is supported by the strong bearish signals given by short-term moving averages. An assessment of moving averages reveals a bearish signal that could impact this trend:
Bearish trend reversal : Moving Average 100
Type : Bearish
Timeframe : Daily
Technical indicators are bearish. There is still some doubt about the decline in the price.
Central Indicators, the scanner specialised in technical indicators, has identified these signals:
Pivot points : price is under support 1
Type : Neutral
Timeframe : Weekly
Price is back over the pivot point
Type : Bullish
Timeframe : Daily
Central Patterns, the market scanner focusing on chart patterns, resistances and supports found these results:
Near horizontal support
Type : Bullish
Timeframe : Daily
Near support of triangle
Type : Bullish
Timeframe : Daily
Support of channel is broken
Type : Bearish
Timeframe : Daily
The Central Candlesticks scanner, specialised in Japanese candlesticks, did not identify any signals.
| S3 | S2 | S1 | Price | R1 | R2 | R3 | |
|---|---|---|---|---|---|---|---|
| ProTrendLines | 100.4 | 105.5 | 110.0 | 115.0 | 115.8 | 121.4 | 129.5 |
| Change (%) | -12.70% | -8.26% | -4.35% | - | +0.70% | +5.57% | +12.61% |
| Change | -14.6 | -9.5 | -5.0 | - | +0.8 | +6.4 | +14.5 |
| Level | Minor | Intermediate | Major | - | Minor | Major | Intermediate |
To determine price objectives, it is also possible to use the pivot points. Here is the price position in relation to pivot points:
| Pivot points | S3 | S2 | S1 | PP | R1 | R2 | R3 |
|---|---|---|---|---|---|---|---|
| Standard | 110.7 | 112.1 | 113.1 | 114.5 | 115.5 | 116.9 | 117.9 |
| Camarilla | 113.3 | 113.6 | 113.8 | 114.0 | 114.2 | 114.4 | 114.7 |
| Woodie | 110.4 | 112.0 | 112.8 | 114.4 | 115.2 | 116.8 | 117.6 |
| Fibonacci | 112.1 | 113.1 | 113.6 | 114.5 | 115.5 | 116.0 | 116.9 |
| Pivot points | S3 | S2 | S1 | PP | R1 | R2 | R3 |
|---|---|---|---|---|---|---|---|
| Standard | 110.3 | 113.4 | 115.9 | 119.0 | 121.5 | 124.6 | 127.1 |
| Camarilla | 116.8 | 117.3 | 117.8 | 118.3 | 118.8 | 119.3 | 119.8 |
| Woodie | 109.9 | 113.3 | 115.5 | 118.9 | 121.1 | 124.5 | 126.7 |
| Fibonacci | 113.4 | 115.6 | 116.9 | 119.0 | 121.2 | 122.5 | 124.6 |
| Pivot points | S3 | S2 | S1 | PP | R1 | R2 | R3 |
|---|---|---|---|---|---|---|---|
| Standard | 98.1 | 103.6 | 111.9 | 117.4 | 125.7 | 131.2 | 139.5 |
| Camarilla | 116.5 | 117.8 | 119.0 | 120.3 | 121.6 | 122.8 | 124.1 |
| Woodie | 99.6 | 104.3 | 113.4 | 118.1 | 127.2 | 131.9 | 141.0 |
| Fibonacci | 103.6 | 108.8 | 112.1 | 117.4 | 122.6 | 125.9 | 131.2 |
Numerical data
The following is the status of the technical indicators and moving averages at the time of publication of this technical analysis:
| RSI (14): | 42.60 | |
| MACD (12,26,9): | -0.6000 | |
| Directional Movement: | -7.1 | |
| AROON (14): | -57.2 | |
| DEMA (21): | 116.6 | |
| Parabolic SAR (0,02-0,02-0,2): | 121.7 | |
| Elder Ray (13): | -2.6 | |
| Super Trend (3,10): | 113.2 | |
| Zig ZAG (10): | 114.9 | |
| VORTEX (21): | 1.1000 | |
| Stochastique (14,3,5): | 6.60 | |
| TEMA (21): | 116.7 | |
| Williams %R (14): | -83.70 | |
| Chande Momentum Oscillator (20): | -5.4 | |
| Repulse (5,40,3): | -1.9000 | |
| ROCnROLL: | 2 | |
| TRIX (15,9): | 0.0000 | |
| Courbe Coppock: | 1.70 |
| MA7: | 116.8 | |
| MA20: | 117.8 | |
| MA50: | 118.4 | |
| MA100: | 120.6 | |
| MAexp7: | 116.4 | |
| MAexp20: | 117.3 | |
| MAexp50: | 118.3 | |
| MAexp100: | 118.4 | |
| Price / MA7: | -1.54% | |
| Price / MA20: | -2.38% | |
| Price / MA50: | -2.87% | |
| Price / MA100: | -4.64% | |
| Price / MAexp7: | -1.20% | |
| Price / MAexp20: | -1.96% | |
| Price / MAexp50: | -2.79% | |
| Price / MAexp100: | -2.87% |
News
Don't forget to follow the news on ACCIONA. At the time of publication of this analysis, the latest news was as follows:
- Eve and Acciona enter strategic partnership to accelerate the development of a sustainable Urban Air Mobility ecosystem
- Acciona Energia Assigned ESG Evaluation Score Of 86; Preparedness Strong
- Sungrow Supplies Inverters for El Romero Solar High-Tech Hub Developed by Acciona
- Sungrow Supplies Inverters for El Romero Solar High-Tech Hub Developed by Acciona
- ACCIONA Industrial Enhances Global Materials Management with the Use of Intergraph Smart® Materials
About author
Online


Add a comment
Comments
0 comments on the analysis ACCIONA - Daily