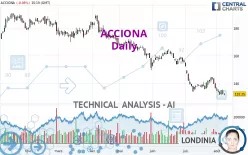
ACCIONA - Daily - Technical analysis published on 08/08/2023 (GMT)
- 234
- 0
Click here for a new analysis!
- Timeframe : Daily
- - Analysis generated on
- Status : TARGET REACHED

Summary of the analysis

Additional analysis
Quotes
ACCIONA rating 132.25 EUR. The price registered a decrease of -0.08% on the session with the lowest point at 131.35 EUR and the highest point at 132.95 EUR. The deviation from the price is +0.69% for the low point and -0.53% for the high point.The Central Gaps scanner detects the formation of a bearish gap marking the strong presence of sellers ahead of buyers at the opening. This formed a quotation gap.
Opening Gap DOWN
Type : Bearish
Timeframe : Openning
Here is a more detailed summary of the historical variations registered by ACCIONA:
New LOW record (1 year)
Type : Bearish
Timeframe : Weekly
New LOW record (1st january)
Type : Bearish
Timeframe : Weekly
New LOW record (1 month)
Type : Bearish
Timeframe : Weekly
Technical
Technical analysis of this Daily chart of ACCIONA indicates that the overall trend is strongly bearish. The signals given by moving averages are 92.86% bearish. This strong bearish trend is confirmed by the strong signals currently being given by short-term moving averages. The Central Indicators scanner does not detect any result on moving averages that would impact this trend.
Technical indicators are slightly bearish. There is therefore considerable uncertainty about the continuation of the decline.
Caution: the Central Indicators scanner currently detects an excess:
CCI indicator is oversold : under -100
Type : Neutral
Timeframe : Daily
Williams %R indicator is oversold : under -80
Type : Neutral
Timeframe : Daily
Central Patterns, the scanner specializing in chart patterns, did not identify any signals.
The Central Candlesticks scanner, specialised in Japanese candlesticks, did not identify any signals.
| S3 | S2 | S1 | Price | R1 | R2 | R3 | |
|---|---|---|---|---|---|---|---|
| ProTrendLines | 91.77 | 112.76 | 127.10 | 132.25 | 138.25 | 146.82 | 159.24 |
| Change (%) | -30.61% | -14.74% | -3.89% | - | +4.54% | +11.02% | +20.41% |
| Change | -40.48 | -19.49 | -5.15 | - | +6.00 | +14.57 | +26.99 |
| Level | Intermediate | Major | Intermediate | - | Major | Minor | Major |
To determine price objectives, it is also possible to use the pivot points. Here is the price position in relation to pivot points:
| Pivot points | S3 | S2 | S1 | PP | R1 | R2 | R3 |
|---|---|---|---|---|---|---|---|
| Standard | 127.32 | 129.58 | 130.97 | 133.23 | 134.62 | 136.88 | 138.27 |
| Camarilla | 131.35 | 131.68 | 132.02 | 132.35 | 132.69 | 133.02 | 133.35 |
| Woodie | 126.88 | 129.36 | 130.53 | 133.01 | 134.18 | 136.66 | 137.83 |
| Fibonacci | 129.58 | 130.98 | 131.84 | 133.23 | 134.63 | 135.49 | 136.88 |
| Pivot points | S3 | S2 | S1 | PP | R1 | R2 | R3 |
|---|---|---|---|---|---|---|---|
| Standard | 121.93 | 126.72 | 130.83 | 135.62 | 139.73 | 144.52 | 148.63 |
| Camarilla | 132.50 | 133.32 | 134.13 | 134.95 | 135.77 | 136.58 | 137.40 |
| Woodie | 121.60 | 126.55 | 130.50 | 135.45 | 139.40 | 144.35 | 148.30 |
| Fibonacci | 126.72 | 130.12 | 132.22 | 135.62 | 139.02 | 141.12 | 144.52 |
| Pivot points | S3 | S2 | S1 | PP | R1 | R2 | R3 |
|---|---|---|---|---|---|---|---|
| Standard | 113.19 | 123.44 | 129.90 | 140.15 | 146.61 | 156.86 | 163.32 |
| Camarilla | 131.76 | 133.29 | 134.82 | 136.35 | 137.88 | 139.41 | 140.95 |
| Woodie | 111.29 | 122.49 | 128.00 | 139.20 | 144.71 | 155.91 | 161.42 |
| Fibonacci | 123.44 | 129.83 | 133.77 | 140.15 | 146.54 | 150.48 | 156.86 |
Numerical data
The following is the status of technical indicators and moving averages registered at the time this technical analysis was created:
| RSI (14): | 34.15 | |
| MACD (12,26,9): | -3.5500 | |
| Directional Movement: | -19.57 | |
| AROON (14): | -57.14 | |
| DEMA (21): | 133.08 | |
| Parabolic SAR (0,02-0,02-0,2): | 140.66 | |
| Elder Ray (13): | -3.87 | |
| Super Trend (3,10): | 141.08 | |
| Zig ZAG (10): | 131.95 | |
| VORTEX (21): | 0.9500 | |
| Stochastique (14,3,5): | 12.59 | |
| TEMA (21): | 132.90 | |
| Williams %R (14): | -95.42 | |
| Chande Momentum Oscillator (20): | -8.60 | |
| Repulse (5,40,3): | -1.8300 | |
| ROCnROLL: | 2 | |
| TRIX (15,9): | -0.3300 | |
| Courbe Coppock: | 5.96 |
| MA7: | 133.73 | |
| MA20: | 137.69 | |
| MA50: | 145.52 | |
| MA100: | 156.56 | |
| MAexp7: | 134.25 | |
| MAexp20: | 137.82 | |
| MAexp50: | 144.80 | |
| MAexp100: | 153.26 | |
| Price / MA7: | -1.11% | |
| Price / MA20: | -3.95% | |
| Price / MA50: | -9.12% | |
| Price / MA100: | -15.53% | |
| Price / MAexp7: | -1.49% | |
| Price / MAexp20: | -4.04% | |
| Price / MAexp50: | -8.67% | |
| Price / MAexp100: | -13.71% |
News
The last news published on ACCIONA at the time of the generation of this analysis was as follows:
- Eve and Acciona enter strategic partnership to accelerate the development of a sustainable Urban Air Mobility ecosystem
- Acciona Energia Assigned ESG Evaluation Score Of 86; Preparedness Strong
- Sungrow Supplies Inverters for El Romero Solar High-Tech Hub Developed by Acciona
- Sungrow Supplies Inverters for El Romero Solar High-Tech Hub Developed by Acciona
- ACCIONA Industrial Enhances Global Materials Management with the Use of Intergraph Smart® Materials
About author
Online


Add a comment
Comments
0 comments on the analysis ACCIONA - Daily