RUBIS
4.04
EUR
(-1.94%)
04/22/2025 - 15:34
Closed 15 min delayed data - Euronext Paris
| Open: | 4.02 |
| Change: | -0.08 |
| Volume: | 2,250 |
| Low: | 4.00 |
| High: | 4.18 |
| High / Low range: | 0.18 |
| Type: | Stocks |
| Ticker: | RUI |
| ISIN: | FR0013269123 |
RUBIS Technical Analyses
To filter analyses please use our advanced search feature.
RUBIS - More technical analyses...
RUBIS - More technical analyses...
- 5
- 118
- 86
- 5
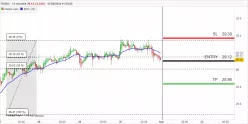
Chart + Trading signal
- 09/01/2024 - 03:43
- 177
- 0
- 1
- 0
- 94.1k
- 15.8k
- 0
Status : INVALID
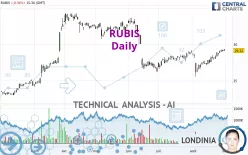
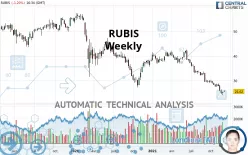
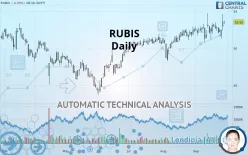
Simple chart
- 08/31/2024 - 10:10
- 157
- 0
- 0
- 0
- 94.1k
- 15.8k
- 0
Status : INVALID
Simple chart
- 12/08/2021 - 06:03
- 311
- 0
- 0
- 0
- 94.1k
- 15.8k
- 0
Status : INVALID
Simple chart
- 09/27/2019 - 08:41
- 345
- 0
- 1

