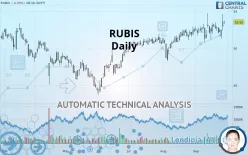
RUBIS - Daily - Technical analysis published on 09/27/2019 (GMT)
- 321
- 0
- Who voted?
Click here for a new analysis!
- Timeframe : Daily
- - Analysis generated on
- Status : INVALID

Summary of the analysis

Additional analysis
Quotes
The RUBIS rating is 53.55 EUR. The price is lower by -0.09% since the last closing with the lowest point at 53.25 EUR and the highest point at 53.75 EUR. The deviation from the price is +0.56% for the low point and -0.37% for the high point.The Central Gaps scanner detects a bearish opening. A small advantage for sellers in the very short term.
Bearish opening
Type : Bearish
Timeframe : Openning
A study of price movements over other periods shows the following variations:
Near a new HIGH record (1st january)
Type : Bullish
Timeframe : Weekly
Technical
A technical analysis in Daily of this RUBIS chart shows a strongly bullish trend. 92.86% of the signals given by moving averages are bullish. The overall trend is supported by the strong bullish signals from short-term moving averages. The Central Indicators scanner detects a bullish signal on moving averages that could impact this trend:
Bullish price crossover with Moving Average 20
Type : Bullish
Timeframe : Daily
In fact, according to the parameters integrated into the Central Analyzer system, 12 technical indicators out of 18 analysed are currently bullish. But beware of excesses. The Central Indicators scanner currently detects this:
CCI indicator is overbought : over 100
Type : Neutral
Timeframe : Daily
Williams %R indicator is overbought : over -20
Type : Neutral
Timeframe : Daily
RSI indicator is back over 50
Type : Bullish
Timeframe : Daily
Ichimoku - Bullish crossover : Tenkan & Kijun
Type : Bullish
Timeframe : Daily
Price is back over the pivot point
Type : Bullish
Timeframe : Daily
Momentum indicator is back over 0
Type : Bullish
Timeframe : Daily
Williams %R indicator is back over -50
Type : Bullish
Timeframe : Daily
The Central Patterns scanner, which studies chart patterns, resistances and supports, has identified these signals:
Near horizontal resistance
Type : Bearish
Timeframe : Daily
Resistance of channel is broken
Type : Bullish
Timeframe : Daily
Resistance of triangle is broken
Type : Bullish
Timeframe : Daily
No result was found by the Central Candlesticks scanner on Japanese candlesticks.
| S3 | S2 | S1 | Price | R1 | R2 | R3 | |
|---|---|---|---|---|---|---|---|
| ProTrendLines | 48.65 | 51.50 | 52.95 | 53.55 | 56.26 | 60.90 | 65.35 |
| Change (%) | -9.15% | -3.83% | -1.12% | - | +5.06% | +13.73% | +22.04% |
| Change | -4.90 | -2.05 | -0.60 | - | +2.71 | +7.35 | +11.80 |
| Level | Intermediate | Major | Major | - | Minor | Minor | Major |
To determine price objectives, it is also possible to use the pivot points. Here is the price position in relation to pivot points:
| Pivot points | S3 | S2 | S1 | PP | R1 | R2 | R3 |
|---|---|---|---|---|---|---|---|
| Standard | 50.18 | 51.27 | 52.43 | 53.52 | 54.68 | 55.77 | 56.93 |
| Camarilla | 52.98 | 53.19 | 53.39 | 53.60 | 53.81 | 54.01 | 54.22 |
| Woodie | 50.23 | 51.29 | 52.48 | 53.54 | 54.73 | 55.79 | 56.98 |
| Fibonacci | 51.27 | 52.13 | 52.66 | 53.52 | 54.38 | 54.91 | 55.77 |
| Pivot points | S3 | S2 | S1 | PP | R1 | R2 | R3 |
|---|---|---|---|---|---|---|---|
| Standard | 49.05 | 50.10 | 51.40 | 52.45 | 53.75 | 54.80 | 56.10 |
| Camarilla | 52.05 | 52.27 | 52.49 | 52.70 | 52.92 | 53.13 | 53.35 |
| Woodie | 49.18 | 50.16 | 51.53 | 52.51 | 53.88 | 54.86 | 56.23 |
| Fibonacci | 50.10 | 51.00 | 51.55 | 52.45 | 53.35 | 53.90 | 54.80 |
| Pivot points | S3 | S2 | S1 | PP | R1 | R2 | R3 |
|---|---|---|---|---|---|---|---|
| Standard | 44.97 | 46.61 | 49.61 | 51.25 | 54.25 | 55.89 | 58.89 |
| Camarilla | 51.32 | 51.75 | 52.18 | 52.60 | 53.03 | 53.45 | 53.88 |
| Woodie | 45.64 | 46.95 | 50.28 | 51.59 | 54.92 | 56.23 | 59.56 |
| Fibonacci | 46.61 | 48.39 | 49.48 | 51.25 | 53.03 | 54.12 | 55.89 |
Numerical data
The following are the details of the technical indicators and moving averages that were collected to generate this technical analysis:
| RSI (14): | 56.57 | |
| MACD (12,26,9): | 0.3200 | |
| Directional Movement: | 7.21 | |
| AROON (14): | 14.29 | |
| DEMA (21): | 52.97 | |
| Parabolic SAR (0,02-0,02-0,2): | 54.61 | |
| Elder Ray (13): | 0.83 | |
| Super Trend (3,10): | 50.65 | |
| Zig ZAG (10): | 53.55 | |
| VORTEX (21): | 0.9800 | |
| Stochastique (14,3,5): | 54.01 | |
| TEMA (21): | 52.91 | |
| Williams %R (14): | -30.38 | |
| Chande Momentum Oscillator (20): | 1.75 | |
| Repulse (5,40,3): | -0.2100 | |
| ROCnROLL: | 1 | |
| TRIX (15,9): | 0.0900 | |
| Courbe Coppock: | 1.33 |
| MA7: | 52.68 | |
| MA20: | 52.52 | |
| MA50: | 51.74 | |
| MA100: | 49.57 | |
| MAexp7: | 52.80 | |
| MAexp20: | 52.48 | |
| MAexp50: | 51.66 | |
| MAexp100: | 50.48 | |
| Price / MA7: | +1.65% | |
| Price / MA20: | +1.96% | |
| Price / MA50: | +3.50% | |
| Price / MA100: | +8.03% | |
| Price / MAexp7: | +1.42% | |
| Price / MAexp20: | +2.04% | |
| Price / MAexp50: | +3.66% | |
| Price / MAexp100: | +6.08% |
News
The latest news and videos published on RUBIS at the time of the analysis were as follows:
- RUBIS: A robust first half - EBIT: up 17% - Net profit: up 24%
- RUBIS: Availability of the 2019 half-year financial report
- RUBIS: Disclosure of the total number of voting rights and of the number of shares on 08/31/2019
- RUBIS: Disclosure of the total number of voting rights and of the number of shares on 07/31/2019
- RUBIS: Result of the option for dividend payment in shares
About author

Online


Add a comment
Comments
0 comments on the analysis RUBIS - Daily