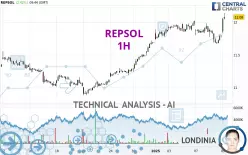
REPSOL - 1H - Technical analysis published on 01/09/2025 (GMT)
- 97
- 0
Click here for a new analysis!
- Timeframe : 1H
- - Analysis generated on
- Status : INVALID

Summary of the analysis

Additional analysis
Quotes
REPSOL rating 12.080 EUR. The price registered an increase of +2.42% on the session and was between 11.830 EUR and 12.140 EUR. This implies that the price is at +2.11% from its lowest and at -0.49% from its highest.A bullish opening was detected by the Central Gaps scanner. Buyers are trying to impose a bullish momentum in the very short term.
Bullish opening
Type : Bullish
Timeframe : Openning
Here is a more detailed summary of the historical variations registered by REPSOL:
New HIGH record (1st january)
Type : Bullish
Timeframe : Weekly
New HIGH record (1 month)
Type : Bullish
Timeframe : Weekly
Technical
Technical analysis of REPSOL in 1H shows a strongly overall bullish trend. 89.29% of the signals given by moving averages are bullish. The overall trend is supported by the strong bullish signals from short-term moving averages. The Central Indicators market scanner is currently detecting several bullish signals that could impact this trend:
Bullish trend reversal : Moving Average 20
Type : Bullish
Timeframe : 1 hour
Bullish trend reversal : adaptative moving average 20
Type : Bullish
Timeframe : 1 hour
The probability of a further increase is high given the direction of the technical indicators.
But beware of excesses. The Central Indicators scanner currently detects this:
CCI indicator is overbought : over 100
Type : Neutral
Timeframe : 1 hour
Williams %R indicator is overbought : over -20
Type : Neutral
Timeframe : 1 hour
Pivot points : price is over resistance 2
Type : Neutral
Timeframe : 1 hour
MACD indicator is back over 0
Type : Bullish
Timeframe : 1 hour
Central Patterns, the market scanner focusing on chart patterns, resistances and supports found these results:
Near horizontal resistance
Type : Bearish
Timeframe : 1 hour
Resistance of channel is broken
Type : Bullish
Timeframe : 1 hour
No result was found by the Central Candlesticks scanner on Japanese candlesticks.
| S3 | S2 | S1 | Price | R1 | R2 | R3 | |
|---|---|---|---|---|---|---|---|
| ProTrendLines | 11.800 | 11.890 | 11.995 | 12.080 | 14.220 | 14.636 | 15.633 |
| Change (%) | -2.32% | -1.57% | -0.70% | - | +17.72% | +21.16% | +29.41% |
| Change | -0.280 | -0.190 | -0.085 | - | +2.140 | +2.556 | +3.553 |
| Level | Intermediate | Minor | Major | - | Major | Major | Major |
To determine price objectives, it is also possible to use the pivot points. Here is the price position in relation to pivot points:
| Pivot points | S3 | S2 | S1 | PP | R1 | R2 | R3 |
|---|---|---|---|---|---|---|---|
| Standard | 11.438 | 11.552 | 11.673 | 11.787 | 11.908 | 12.022 | 12.143 |
| Camarilla | 11.730 | 11.752 | 11.774 | 11.795 | 11.817 | 11.838 | 11.860 |
| Woodie | 11.443 | 11.554 | 11.678 | 11.789 | 11.913 | 12.024 | 12.148 |
| Fibonacci | 11.552 | 11.641 | 11.697 | 11.787 | 11.876 | 11.932 | 12.022 |
| Pivot points | S3 | S2 | S1 | PP | R1 | R2 | R3 |
|---|---|---|---|---|---|---|---|
| Standard | 10.700 | 10.970 | 11.420 | 11.690 | 12.140 | 12.410 | 12.860 |
| Camarilla | 11.672 | 11.738 | 11.804 | 11.870 | 11.936 | 12.002 | 12.068 |
| Woodie | 10.790 | 11.015 | 11.510 | 11.735 | 12.230 | 12.455 | 12.950 |
| Fibonacci | 10.970 | 11.245 | 11.415 | 11.690 | 11.965 | 12.135 | 12.410 |
| Pivot points | S3 | S2 | S1 | PP | R1 | R2 | R3 |
|---|---|---|---|---|---|---|---|
| Standard | 10.107 | 10.493 | 11.092 | 11.478 | 12.077 | 12.463 | 13.062 |
| Camarilla | 11.419 | 11.509 | 11.600 | 11.690 | 11.780 | 11.871 | 11.961 |
| Woodie | 10.213 | 10.546 | 11.198 | 11.531 | 12.183 | 12.516 | 13.168 |
| Fibonacci | 10.493 | 10.870 | 11.102 | 11.478 | 11.855 | 12.087 | 12.463 |
Numerical data
The following are the details of the technical indicators and moving averages that were collected to generate this technical analysis:
| RSI (14): | 67.50 | |
| MACD (12,26,9): | 0.0170 | |
| Directional Movement: | 24.807 | |
| AROON (14): | 35.714 | |
| DEMA (21): | 11.878 | |
| Parabolic SAR (0,02-0,02-0,2): | 11.673 | |
| Elder Ray (13): | 0.226 | |
| Super Trend (3,10): | 11.828 | |
| Zig ZAG (10): | 12.075 | |
| VORTEX (21): | 1.0260 | |
| Stochastique (14,3,5): | 74.40 | |
| TEMA (21): | 11.859 | |
| Williams %R (14): | -13.68 | |
| Chande Momentum Oscillator (20): | 0.145 | |
| Repulse (5,40,3): | 1.6860 | |
| ROCnROLL: | 1 | |
| TRIX (15,9): | -0.0110 | |
| Courbe Coppock: | 0.40 |
| MA7: | 11.879 | |
| MA20: | 11.459 | |
| MA50: | 11.575 | |
| MA100: | 11.787 | |
| MAexp7: | 11.899 | |
| MAexp20: | 11.861 | |
| MAexp50: | 11.787 | |
| MAexp100: | 11.649 | |
| Price / MA7: | +1.69% | |
| Price / MA20: | +5.42% | |
| Price / MA50: | +4.36% | |
| Price / MA100: | +2.49% | |
| Price / MAexp7: | +1.52% | |
| Price / MAexp20: | +1.85% | |
| Price / MAexp50: | +2.49% | |
| Price / MAexp100: | +3.70% |
News
The latest news and videos published on REPSOL at the time of the analysis were as follows:
- Erik Martel and Ignacio Martínez exit the Asterion Energies Group after its sale to Repsol for 560 million Euros
- Repsol Accelerates Digital Journey with Halliburton Landmark to Automate and Streamline Its Well Design Process
- Repsol Oil & Gas Canada Inc. announces redemption of its outstanding senior notes and debentures
- HyCOgen and FT CANS, innovative technologies to enable sustainable fuel production selected for Repsol and Aramco's synthetic fuel plant in Bilbao
- Emerson's Cloud-Hosted Software Helps Repsol to Boost Performance
About author
Online


Add a comment
Comments
0 comments on the analysis REPSOL - 1H