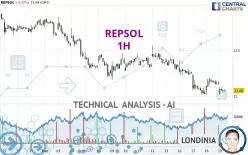
REPSOL - 1H - Technical analysis published on 12/19/2024 (GMT)
- 92
- 0
Click here for a new analysis!
- Timeframe : 1H
- - Analysis generated on
- Status : LEVEL MAINTAINED

Summary of the analysis

Additional analysis
Quotes
The REPSOL price is 11.060 EUR. On the day, this instrument lost -0.72% with the lowest point at 11.015 EUR and the highest point at 11.100 EUR. The deviation from the price is +0.41% for the low point and -0.36% for the high point.A bearish opening was detected by the Central Gaps scanner. Sellers are trying to impose a bearish trend in the very short term.
Bearish opening
Type : Bearish
Timeframe : Openning
A study of price movements over other periods shows the following variations:
Near a new LOW record (1 year)
Type : Bearish
Timeframe : Weekly
Near a new LOW record (1st january)
Type : Bearish
Timeframe : Weekly
Near a new LOW record (1 month)
Type : Bearish
Timeframe : Weekly
Technical
Technical analysis of REPSOL in 1H shows a overall strongly bearish trend. The signals given by moving averages are 92.86% bearish. This strong bearish trend is confirmed by the strong signals currently being given by short-term moving averages. The Central Indicators market scanner currently does not detect any result that concerns moving averages.
An assessment of technical indicators does not currently provide any relevant information on the direction of future price movements.
Other results related to technical indicators were also found by the Central Indicators scanner:
Pivot points : price is under support 1
Type : Neutral
Timeframe : Weekly
Momentum indicator is back under 0
Type : Bearish
Timeframe : 1 hour
Central Patterns, the scanner specializing in chart patterns, did not identify any signals.
The Central Candlesticks scanner currently notes the presence of this pattern in Japanese candlesticks that could mark the end of the short-term trend currently underway:
Doji
Type : Neutral
Timeframe : 1 hour
| S3 | S2 | S1 | Price | R1 | R2 | R3 | |
|---|---|---|---|---|---|---|---|
| ProTrendLines | 8.224 | 9.926 | 11.010 | 11.060 | 11.175 | 11.462 | 11.670 |
| Change (%) | -25.64% | -10.25% | -0.45% | - | +1.04% | +3.63% | +5.52% |
| Change | -2.836 | -1.134 | -0.050 | - | +0.115 | +0.402 | +0.610 |
| Level | Minor | Major | Intermediate | - | Minor | Intermediate | Intermediate |
To determine price objectives, it is also possible to use the pivot points. Here is the price position in relation to pivot points:
| Pivot points | S3 | S2 | S1 | PP | R1 | R2 | R3 |
|---|---|---|---|---|---|---|---|
| Standard | 10.850 | 10.930 | 11.035 | 11.115 | 11.220 | 11.300 | 11.405 |
| Camarilla | 11.089 | 11.106 | 11.123 | 11.140 | 11.157 | 11.174 | 11.191 |
| Woodie | 10.863 | 10.936 | 11.048 | 11.121 | 11.233 | 11.306 | 11.418 |
| Fibonacci | 10.930 | 11.001 | 11.044 | 11.115 | 11.186 | 11.229 | 11.300 |
| Pivot points | S3 | S2 | S1 | PP | R1 | R2 | R3 |
|---|---|---|---|---|---|---|---|
| Standard | 10.762 | 10.968 | 11.142 | 11.348 | 11.522 | 11.728 | 11.902 |
| Camarilla | 11.211 | 11.245 | 11.280 | 11.315 | 11.350 | 11.385 | 11.420 |
| Woodie | 10.745 | 10.960 | 11.125 | 11.340 | 11.505 | 11.720 | 11.885 |
| Fibonacci | 10.968 | 11.114 | 11.203 | 11.348 | 11.494 | 11.583 | 11.728 |
| Pivot points | S3 | S2 | S1 | PP | R1 | R2 | R3 |
|---|---|---|---|---|---|---|---|
| Standard | 10.568 | 10.902 | 11.363 | 11.697 | 12.158 | 12.492 | 12.953 |
| Camarilla | 11.606 | 11.679 | 11.752 | 11.825 | 11.898 | 11.971 | 12.044 |
| Woodie | 10.633 | 10.934 | 11.428 | 11.729 | 12.223 | 12.524 | 13.018 |
| Fibonacci | 10.902 | 11.205 | 11.393 | 11.697 | 12.000 | 12.188 | 12.492 |
Numerical data
The following are the details of the technical indicators and moving averages that were collected to generate this technical analysis:
| RSI (14): | 35.58 | |
| MACD (12,26,9): | -0.0400 | |
| Directional Movement: | -15.842 | |
| AROON (14): | 14.285 | |
| DEMA (21): | 11.068 | |
| Parabolic SAR (0,02-0,02-0,2): | 11.184 | |
| Elder Ray (13): | -0.048 | |
| Super Trend (3,10): | 11.213 | |
| Zig ZAG (10): | 11.060 | |
| VORTEX (21): | 0.9830 | |
| Stochastique (14,3,5): | 27.93 | |
| TEMA (21): | 11.073 | |
| Williams %R (14): | -72.97 | |
| Chande Momentum Oscillator (20): | -0.050 | |
| Repulse (5,40,3): | 0.1590 | |
| ROCnROLL: | 2 | |
| TRIX (15,9): | -0.0550 | |
| Courbe Coppock: | 0.17 |
| MA7: | 11.216 | |
| MA20: | 11.471 | |
| MA50: | 11.632 | |
| MA100: | 11.916 | |
| MAexp7: | 11.088 | |
| MAexp20: | 11.124 | |
| MAexp50: | 11.208 | |
| MAexp100: | 11.314 | |
| Price / MA7: | -1.39% | |
| Price / MA20: | -3.58% | |
| Price / MA50: | -4.92% | |
| Price / MA100: | -7.18% | |
| Price / MAexp7: | -0.25% | |
| Price / MAexp20: | -0.58% | |
| Price / MAexp50: | -1.32% | |
| Price / MAexp100: | -2.25% |
News
The last news published on REPSOL at the time of the generation of this analysis was as follows:
- Erik Martel and Ignacio Martínez exit the Asterion Energies Group after its sale to Repsol for 560 million Euros
- Repsol Accelerates Digital Journey with Halliburton Landmark to Automate and Streamline Its Well Design Process
- Repsol Oil & Gas Canada Inc. announces redemption of its outstanding senior notes and debentures
- HyCOgen and FT CANS, innovative technologies to enable sustainable fuel production selected for Repsol and Aramco's synthetic fuel plant in Bilbao
- Emerson's Cloud-Hosted Software Helps Repsol to Boost Performance
About author
Online


Add a comment
Comments
0 comments on the analysis REPSOL - 1H