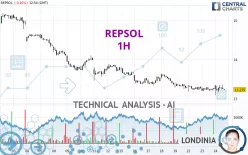
REPSOL - 1H - Technical analysis published on 07/24/2024 (GMT)
- 146
- 0
Click here for a new analysis!
- Timeframe : 1H
- - Analysis generated on
- Status : TARGET REACHED

Summary of the analysis

Additional analysis
Quotes
The REPSOL price is 13.260 EUR. On the day, this instrument lost -0.08% with the lowest point at 13.090 EUR and the highest point at 13.350 EUR. The deviation from the price is +1.30% for the low point and -0.67% for the high point.A bullish gap was detected at the opening by the Central Gaps scanner. There are a lot of buyers and they have the upper hand in the very short term.
Opening Gap UP
Type : Bullish
Timeframe : Openning
Here is a more detailed summary of the historical variations registered by REPSOL:
Near a new LOW record (1st january)
Type : Bearish
Timeframe : Weekly
New LOW record (1 month)
Type : Bearish
Timeframe : Weekly
Technical
Technical analysis of this 1H chart of REPSOL indicates that the overall trend is bearish. 78.57% of the signals given by moving averages are bearish. Caution: the neutral signals currently given by short-term moving averages show us that the global trend is losing momentum. The Central Indicators scanner detects a bullish signal on moving averages that could impact this trend:
Bullish trend reversal : Moving Average 20
Type : Bullish
Timeframe : 1 hour
In fact, only 9 technical indicators out of 18 studied are currently positioned bullish. Caution: the Central Indicators scanner currently detects an excess:
CCI indicator is overbought : over 100
Type : Neutral
Timeframe : 1 hour
Williams %R indicator is overbought : over -20
Type : Neutral
Timeframe : 1 hour
RSI indicator is back over 50
Type : Bullish
Timeframe : 1 hour
No signals are given by Central Patterns, a market scanner specialised in chart patterns, resistances and supports.
No result was found by the Central Candlesticks scanner on Japanese candlesticks.
| S3 | S2 | S1 | Price | R1 | R2 | R3 | |
|---|---|---|---|---|---|---|---|
| ProTrendLines | 12.450 | 12.947 | 13.188 | 13.260 | 13.326 | 13.645 | 13.893 |
| Change (%) | -6.11% | -2.36% | -0.54% | - | +0.50% | +2.90% | +4.77% |
| Change | -0.810 | -0.313 | -0.072 | - | +0.066 | +0.385 | +0.633 |
| Level | Major | Minor | Intermediate | - | Minor | Minor | Intermediate |
Pivot points can also be used to set your price objectives. Here is the price situation in relation to pivot points:
| Pivot points | S3 | S2 | S1 | PP | R1 | R2 | R3 |
|---|---|---|---|---|---|---|---|
| Standard | 13.105 | 13.150 | 13.210 | 13.255 | 13.315 | 13.360 | 13.420 |
| Camarilla | 13.241 | 13.251 | 13.260 | 13.270 | 13.280 | 13.289 | 13.299 |
| Woodie | 13.113 | 13.154 | 13.218 | 13.259 | 13.323 | 13.364 | 13.428 |
| Fibonacci | 13.150 | 13.190 | 13.215 | 13.255 | 13.295 | 13.320 | 13.360 |
| Pivot points | S3 | S2 | S1 | PP | R1 | R2 | R3 |
|---|---|---|---|---|---|---|---|
| Standard | 12.537 | 12.893 | 13.092 | 13.448 | 13.647 | 14.003 | 14.202 |
| Camarilla | 13.137 | 13.188 | 13.239 | 13.290 | 13.341 | 13.392 | 13.443 |
| Woodie | 12.458 | 12.854 | 13.013 | 13.409 | 13.568 | 13.964 | 14.123 |
| Fibonacci | 12.893 | 13.105 | 13.236 | 13.448 | 13.660 | 13.791 | 14.003 |
| Pivot points | S3 | S2 | S1 | PP | R1 | R2 | R3 |
|---|---|---|---|---|---|---|---|
| Standard | 12.583 | 13.090 | 13.666 | 14.173 | 14.749 | 15.256 | 15.832 |
| Camarilla | 13.943 | 14.043 | 14.142 | 14.241 | 14.340 | 14.440 | 14.539 |
| Woodie | 12.617 | 13.107 | 13.700 | 14.190 | 14.783 | 15.273 | 15.866 |
| Fibonacci | 13.090 | 13.504 | 13.760 | 14.173 | 14.587 | 14.843 | 15.256 |
Numerical data
The following is the status of technical indicators and moving averages registered at the time this technical analysis was created:
| RSI (14): | 50.92 | |
| MACD (12,26,9): | -0.0190 | |
| Directional Movement: | -6.987 | |
| AROON (14): | 21.428 | |
| DEMA (21): | 13.237 | |
| Parabolic SAR (0,02-0,02-0,2): | 13.100 | |
| Elder Ray (13): | 0.039 | |
| Super Trend (3,10): | 13.414 | |
| Zig ZAG (10): | 13.270 | |
| VORTEX (21): | 1.0060 | |
| Stochastique (14,3,5): | 71.15 | |
| TEMA (21): | 13.257 | |
| Williams %R (14): | -34.62 | |
| Chande Momentum Oscillator (20): | 0.020 | |
| Repulse (5,40,3): | -0.2990 | |
| ROCnROLL: | 2 | |
| TRIX (15,9): | -0.0360 | |
| Courbe Coppock: | 0.05 |
| MA7: | 13.339 | |
| MA20: | 13.864 | |
| MA50: | 14.070 | |
| MA100: | 14.328 | |
| MAexp7: | 13.260 | |
| MAexp20: | 13.276 | |
| MAexp50: | 13.359 | |
| MAexp100: | 13.533 | |
| Price / MA7: | -0.59% | |
| Price / MA20: | -4.36% | |
| Price / MA50: | -5.76% | |
| Price / MA100: | -7.45% | |
| Price / MAexp7: | -0% | |
| Price / MAexp20: | -0.12% | |
| Price / MAexp50: | -0.74% | |
| Price / MAexp100: | -2.02% |
News
The last news published on REPSOL at the time of the generation of this analysis was as follows:
- Erik Martel and Ignacio Martínez exit the Asterion Energies Group after its sale to Repsol for 560 million Euros
- Repsol Accelerates Digital Journey with Halliburton Landmark to Automate and Streamline Its Well Design Process
- Repsol Oil & Gas Canada Inc. announces redemption of its outstanding senior notes and debentures
- HyCOgen and FT CANS, innovative technologies to enable sustainable fuel production selected for Repsol and Aramco's synthetic fuel plant in Bilbao
- Emerson's Cloud-Hosted Software Helps Repsol to Boost Performance
About author
Online


Add a comment
Comments
0 comments on the analysis REPSOL - 1H