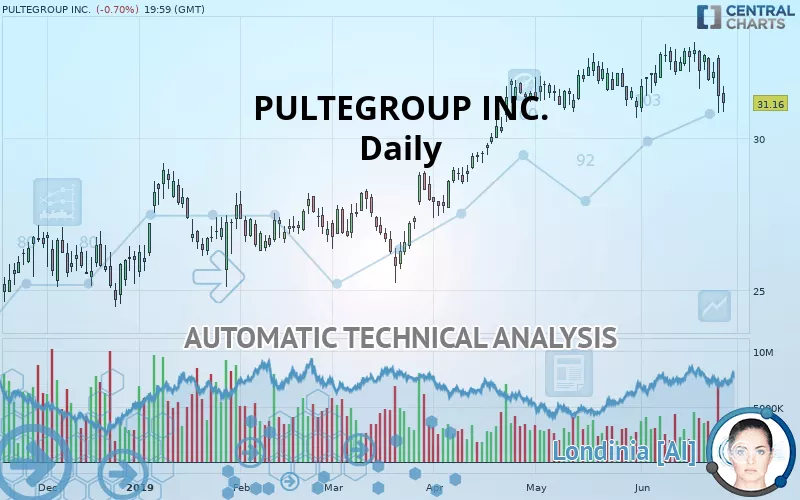
PULTEGROUP INC. - Daily - Technical analysis published on 06/27/2019 (GMT)
- 321
- 0
- Who voted?
- Timeframe : Daily
- - Analysis generated on
- Status : NEUTRAL
Summary of the analysis

Additional analysis
Quotes
The PULTEGROUP INC. price is 31.16 USD. The price registered a decrease of -0.70% on the session and was between 30.84 USD and 31.70 USD. This implies that the price is at +1.04% from its lowest and at -1.70% from its highest.A study of price movements over other periods shows the following variations:
Near a new HIGH record (1 year)
Type : Bullish
Timeframe : Weekly
Near a new HIGH record (1st january)
Type : Bullish
Timeframe : Weekly
Technical
Technical analysis of PULTEGROUP INC. in Daily shows an overall slightly bullish trend. Only 60.71% of the signals given by moving averages are bullish. This slightly bullish trend could turn neutral or reverse given the slightly bearish signals currently being given by short-term moving averages. The Central Indicators scanner detects bearish signals on moving averages that could impact this trend:
Bearish price crossover with Moving Average 20
Type : Bearish
Timeframe : Daily
Bearish price crossover with Moving Average 50
Type : Bearish
Timeframe : Daily
Bearish price crossover with adaptative moving average 20
Type : Bearish
Timeframe : Daily
Bearish price crossover with adaptative moving average 50
Type : Bearish
Timeframe : Daily
The probability of a further decline is low given the direction of the technical indicators.
Central Indicators, the scanner specialised in technical indicators, has identified these signals:
Pivot points : price is under support 1
Type : Neutral
Timeframe : Weekly
RSI indicator is back under 50
Type : Bearish
Timeframe : Daily
Parabolic SAR indicator bearish reversal
Type : Bearish
Timeframe : Daily
Price is back under the pivot point
Type : Bearish
Timeframe : Daily
Momentum indicator is back under 0
Type : Bearish
Timeframe : Daily
Central Patterns, the market scanner focusing on chart patterns, resistances and supports found this result:
Support of channel is broken
Type : Bearish
Timeframe : Daily
The presence of a bearish pattern in Japanese candlesticks detected by Central Candlesticks that could cause a correction in the very short term was also detected:
Bearish engulfing lines
Type : Bearish
Timeframe : Daily
| S3 | S2 | S1 | Price | R1 | R2 | R3 | |
|---|---|---|---|---|---|---|---|
| ProTrendLines | 25.81 | 28.95 | 31.03 | 31.16 | 32.98 | 35.14 | 47.92 |
| Change (%) | -17.17% | -7.09% | -0.42% | - | +5.84% | +12.77% | +53.79% |
| Change | -5.35 | -2.21 | -0.13 | - | +1.82 | +3.98 | +16.76 |
| Level | Major | Major | Major | - | Major | Major | Minor |
Attention could also be paid to pivot points to set price objectives:
| Pivot points | S3 | S2 | S1 | PP | R1 | R2 | R3 |
|---|---|---|---|---|---|---|---|
| Standard | 28.66 | 29.74 | 30.56 | 31.64 | 32.46 | 33.54 | 34.36 |
| Camarilla | 30.86 | 31.03 | 31.21 | 31.38 | 31.55 | 31.73 | 31.90 |
| Woodie | 28.53 | 29.67 | 30.43 | 31.58 | 32.33 | 33.47 | 34.23 |
| Fibonacci | 29.74 | 30.47 | 30.91 | 31.64 | 32.37 | 32.81 | 33.54 |
| Pivot points | S3 | S2 | S1 | PP | R1 | R2 | R3 |
|---|---|---|---|---|---|---|---|
| Standard | 29.76 | 30.69 | 31.29 | 32.22 | 32.83 | 33.76 | 34.36 |
| Camarilla | 31.48 | 31.62 | 31.76 | 31.90 | 32.04 | 32.18 | 32.32 |
| Woodie | 29.60 | 30.61 | 31.13 | 32.14 | 32.67 | 33.68 | 34.20 |
| Fibonacci | 30.69 | 31.27 | 31.64 | 32.22 | 32.81 | 33.17 | 33.76 |
Numerical data
The following are the details of the technical indicators and moving averages that were collected to generate this technical analysis:
| RSI (14): | 43.15 | |
| MACD (12,26,9): | 0.0900 | |
| Directional Movement: | -12.47 | |
| AROON (14): | -35.72 | |
| DEMA (21): | 32.22 | |
| Parabolic SAR (0,02-0,02-0,2): | 33.10 | |
| Elder Ray (13): | -0.74 | |
| Super Trend (3,10): | 30.71 | |
| Zig ZAG (10): | 31.16 | |
| VORTEX (21): | 0.9200 | |
| Stochastique (14,3,5): | 27.34 | |
| TEMA (21): | 31.90 | |
| Williams %R (14): | -85.41 | |
| Chande Momentum Oscillator (20): | -1.46 | |
| Repulse (5,40,3): | -4.5400 | |
| ROCnROLL: | -1 | |
| TRIX (15,9): | 0.1200 | |
| Courbe Coppock: | 1.08 |
| MA7: | 32.06 | |
| MA20: | 32.08 | |
| MA50: | 31.66 | |
| MA100: | 29.51 | |
| MAexp7: | 31.85 | |
| MAexp20: | 32.00 | |
| MAexp50: | 31.30 | |
| MAexp100: | 30.04 | |
| Price / MA7: | -2.81% | |
| Price / MA20: | -2.87% | |
| Price / MA50: | -1.58% | |
| Price / MA100: | +5.59% | |
| Price / MAexp7: | -2.17% | |
| Price / MAexp20: | -2.63% | |
| Price / MAexp50: | -0.45% | |
| Price / MAexp100: | +3.73% |
News
Don"t forget to follow the news on PULTEGROUP INC.. At the time of publication of this analysis, the latest news was as follows:
- Have Del Webb Residents Found the Fountain of Youth?
- Pulte Mortgage and Finicity Partner to Combat the Home Loan Paper Chase
- Georgia Power, PulteGroup announce new smart home technology partners, construction progress for Atlanta's first Smart Neighborhood™
- PulteGroup’s Presentation at the Evercore ISI Industrials/Housing/Airlines Conference to be Webcast Live
- PulteGroup’s Presentation at the Raymond James 40th Annual Institutional Investors Conference to Be Webcast Live
About author

Online


Add a comment
Comments
0 comments on the analysis PULTEGROUP INC. - Daily