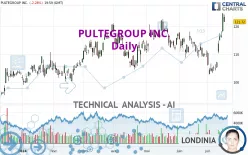
PULTEGROUP INC. - Daily - Technical analysis published on 07/18/2024 (GMT)
- 109
- 0
Click here for a new analysis!
- Timeframe : Daily
- - Analysis generated on
- Status : TARGET REACHED
Summary of the analysis

Additional analysis
Quotes
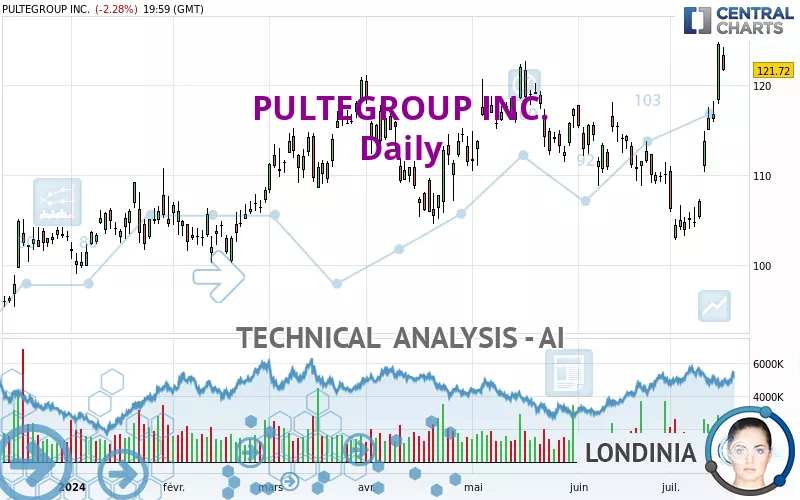
The PULTEGROUP INC. rating is 121.72 USD. On the day, this instrument lost -2.28% and was traded between 121.60 USD and 124.30 USD over the period. The price is currently at +0.10% from its lowest and -2.08% from its highest.The Central Gaps scanner detects a bearish opening marking the presence of sellers ahead of buyers at the opening but not sufficiently marked to allow the price to register a quotation gap.
Bearish opening
Type : Bearish
Timeframe : Openning
Here is a more detailed summary of the historical variations registered by PULTEGROUP INC.:
New HIGH record (5 years)
Type : Bullish
Timeframe : Weekly
Near a new HIGH record (1 year)
Type : Bullish
Timeframe : Weekly
Near a new HIGH record (1st january)
Type : Bullish
Timeframe : Weekly
Near a new HIGH record (1 month)
Type : Bullish
Timeframe : Weekly
Technical
Technical analysis of PULTEGROUP INC. in Daily shows a strongly overall bullish trend. The signals given by the moving averages are 85.71% bullish. This strong bullish trend is confirmed by the strong signals currently being given by short-term moving averages. The Central Indicators scanner does not detect any result on moving averages that would impact this trend.
In fact, 16 technical indicators on 18 studied are currently positioned bullish. Caution: the Central Indicators scanner currently detects an excess:
CCI indicator is overbought : over 100
Type : Neutral
Timeframe : Daily
Previous candle closed over Bollinger bands
Type : Neutral
Timeframe : Daily
Williams %R indicator is overbought : over -20
Type : Neutral
Timeframe : Daily
Pivot points : price is over resistance 1
Type : Neutral
Timeframe : Weekly
Price is back under the pivot point
Type : Bearish
Timeframe : Daily
Central Patterns, the market scanner focusing on chart patterns, resistances and supports found this result:
Near horizontal support
Type : Bullish
Timeframe : Daily
The presence of a bearish pattern in Japanese candlesticks detected by Central Candlesticks that could cause a correction in the very short term was also detected:
Bearish harami
Type : Bearish
Timeframe : Daily
| S3 | S2 | S1 | Price | R1 | |
|---|---|---|---|---|---|
| ProTrendLines | 101.10 | 105.14 | 117.22 | 121.72 | 121.86 |
| Change (%) | -16.94% | -13.62% | -3.70% | - | +0.12% |
| Change | -20.62 | -16.58 | -4.50 | - | +0.14 |
| Level | Intermediate | Major | Intermediate | - | Major |
Pivot points can also be used to set your price objectives. Here is the price situation in relation to pivot points:
| Pivot points | S3 | S2 | S1 | PP | R1 | R2 | R3 |
|---|---|---|---|---|---|---|---|
| Standard | 118.08 | 119.84 | 120.78 | 122.54 | 123.48 | 125.24 | 126.18 |
| Camarilla | 120.98 | 121.23 | 121.47 | 121.72 | 121.97 | 122.22 | 122.46 |
| Woodie | 117.67 | 119.64 | 120.37 | 122.34 | 123.07 | 125.04 | 125.77 |
| Fibonacci | 119.84 | 120.87 | 121.51 | 122.54 | 123.57 | 124.21 | 125.24 |
| Pivot points | S3 | S2 | S1 | PP | R1 | R2 | R3 |
|---|---|---|---|---|---|---|---|
| Standard | 94.19 | 99.10 | 107.72 | 112.63 | 121.25 | 126.16 | 134.78 |
| Camarilla | 112.61 | 113.85 | 115.09 | 116.33 | 117.57 | 118.81 | 120.05 |
| Woodie | 96.04 | 100.03 | 109.57 | 113.56 | 123.10 | 127.09 | 136.63 |
| Fibonacci | 99.10 | 104.27 | 107.47 | 112.63 | 117.80 | 121.00 | 126.16 |
| Pivot points | S3 | S2 | S1 | PP | R1 | R2 | R3 |
|---|---|---|---|---|---|---|---|
| Standard | 97.30 | 102.97 | 106.54 | 112.21 | 115.78 | 121.45 | 125.02 |
| Camarilla | 107.56 | 108.41 | 109.25 | 110.10 | 110.95 | 111.79 | 112.64 |
| Woodie | 96.24 | 102.45 | 105.48 | 111.69 | 114.72 | 120.93 | 123.96 |
| Fibonacci | 102.97 | 106.50 | 108.68 | 112.21 | 115.74 | 117.92 | 121.45 |
Numerical data
The following is the status of the technical indicators and moving averages at the time of publication of this technical analysis:
| RSI (14): | 65.42 | |
| MACD (12,26,9): | 1.5400 | |
| Directional Movement: | 25.55 | |
| AROON (14): | 64.29 | |
| DEMA (21): | 113.90 | |
| Parabolic SAR (0,02-0,02-0,2): | 106.09 | |
| Elder Ray (13): | 9.14 | |
| Super Trend (3,10): | 111.99 | |
| Zig ZAG (10): | 121.72 | |
| VORTEX (21): | 1.0300 | |
| Stochastique (14,3,5): | 90.62 | |
| TEMA (21): | 116.15 | |
| Williams %R (14): | -13.97 | |
| Chande Momentum Oscillator (20): | 11.62 | |
| Repulse (5,40,3): | 2.7100 | |
| ROCnROLL: | 1 | |
| TRIX (15,9): | -0.0900 | |
| Courbe Coppock: | 8.76 |
| MA7: | 114.93 | |
| MA20: | 110.78 | |
| MA50: | 113.56 | |
| MA100: | 112.65 | |
| MAexp7: | 116.61 | |
| MAexp20: | 112.80 | |
| MAexp50: | 112.36 | |
| MAexp100: | 110.30 | |
| Price / MA7: | +5.91% | |
| Price / MA20: | +9.88% | |
| Price / MA50: | +7.19% | |
| Price / MA100: | +8.05% | |
| Price / MAexp7: | +4.38% | |
| Price / MAexp20: | +7.91% | |
| Price / MAexp50: | +8.33% | |
| Price / MAexp100: | +10.35% |
News
The last news published on PULTEGROUP INC. at the time of the generation of this analysis was as follows:
- SHAREHOLDER ALERT: The Miller Law Firm, P.C. Investigates Claims on Behalf of Investors of PulteGroup, Inc. Relating to Alleged Attempts to Suppress Negative Media Reports.
- Building Homes for Heroes pays off mortgage for ailing veteran, honors PulteGroup
- PulteGroup expands Northeast Florida presence with announcement of two new communities in northern St. Johns County
- Trading the Beach for Grandbabies? Del Webb Building New 55+ Communities to Satisfy Growing Demand for Retirees in the Midwest
- PulteGroup Dedicates New Mortgage-Free Home in Southwest Florida to U.S. Army Veteran and Family
About author

Online


Add a comment
Comments
0 comments on the analysis PULTEGROUP INC. - Daily