PROLOGUE - Daily - Technical analysis published on 11/07/2024 (GMT)
- 77
- 0
Click here for a new analysis!
- Timeframe : Daily
- - Analysis generated on
- Status : INVALID
Summary of the analysis

Additional analysis
Quotes
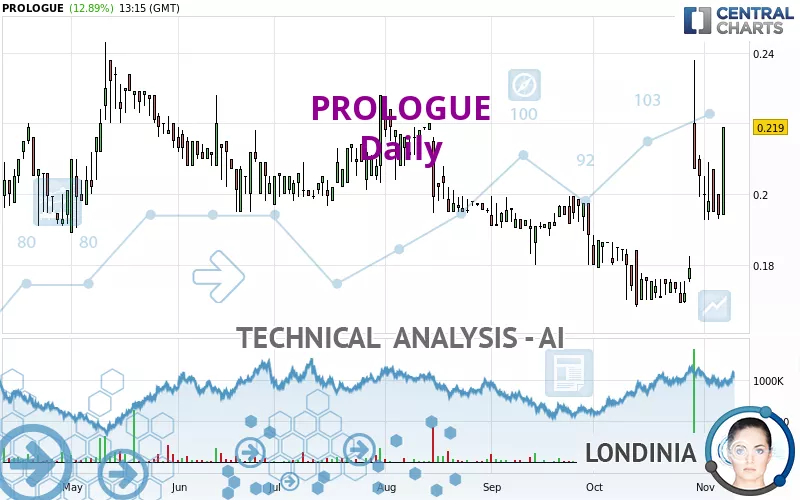
PROLOGUE rating 0.2190 EUR. On the day, this instrument gained +12.89% and was traded between 0.1940 EUR and 0.2190 EUR over the period. The price is currently at +12.89% from its lowest and 0% from its highest.Here is a more detailed summary of the historical variations registered by PROLOGUE:
Technical
Technical analysis of PROLOGUE in Daily shows an overall bullish trend. 67.86% of the signals given by moving averages are bullish. The overall trend seems to be showing some signs of weakness, as do the tentative bullish signals given by short-term moving averages. The Central Indicators scanner detects bullish signals on moving averages that could impact this trend:
Moving Average bullish crossovers : AMA20 & AMA50
Type : Bullish
Timeframe : Daily
Bullish price crossover with Moving Average 100
Type : Bullish
Timeframe : Daily
Technical indicators are strongly bullish, suggesting that the price increase should continue.
Caution: the Central Indicators scanner currently detects an excess:
CCI indicator is overbought : over 100
Type : Neutral
Timeframe : Daily
Pivot points : price is over resistance 3
Type : Neutral
Timeframe : Daily
Ichimoku : price is over the cloud
Type : Bullish
Timeframe : Daily
Price is back over the pivot point
Type : Bullish
Timeframe : Weekly
Williams %R indicator is back over -50
Type : Bullish
Timeframe : Daily
The Central Patterns scanner, which studies chart patterns, resistances and supports, has identified these signals:
Horizontal resistance is broken
Type : Bullish
Timeframe : Daily
Resistance of channel is broken
Type : Bullish
Timeframe : Daily
Resistance of triangle is broken
Type : Bullish
Timeframe : Daily
The Central Candlesticks scanner which studies Japanese candlesticks did not detect anything.
| S3 | S2 | S1 | Price | R1 | R2 | R3 | |
|---|---|---|---|---|---|---|---|
| ProTrendLines | 0.1905 | 0.1976 | 0.2077 | 0.2190 | 0.2200 | 0.2273 | 0.3277 |
| Change (%) | -13.01% | -9.77% | -5.16% | - | +0.46% | +3.79% | +49.63% |
| Change | -0.0285 | -0.0214 | -0.0113 | - | +0.0010 | +0.0083 | +0.1087 |
| Level | Intermediate | Intermediate | Minor | - | Intermediate | Intermediate | Intermediate |
Attention could also be paid to pivot points to set price objectives:
| Pivot points | S3 | S2 | S1 | PP | R1 | R2 | R3 |
|---|---|---|---|---|---|---|---|
| Standard | 0.1843 | 0.1887 | 0.1913 | 0.1957 | 0.1983 | 0.2027 | 0.2053 |
| Camarilla | 0.1921 | 0.1927 | 0.1934 | 0.1940 | 0.1946 | 0.1953 | 0.1959 |
| Woodie | 0.1835 | 0.1883 | 0.1905 | 0.1953 | 0.1975 | 0.2023 | 0.2045 |
| Fibonacci | 0.1887 | 0.1913 | 0.1930 | 0.1957 | 0.1983 | 0.2000 | 0.2027 |
| Pivot points | S3 | S2 | S1 | PP | R1 | R2 | R3 |
|---|---|---|---|---|---|---|---|
| Standard | 0.0977 | 0.1333 | 0.1667 | 0.2023 | 0.2357 | 0.2713 | 0.3047 |
| Camarilla | 0.1810 | 0.1874 | 0.1937 | 0.2000 | 0.2063 | 0.2127 | 0.2190 |
| Woodie | 0.0965 | 0.1328 | 0.1655 | 0.2018 | 0.2345 | 0.2708 | 0.3035 |
| Fibonacci | 0.1333 | 0.1597 | 0.1760 | 0.2023 | 0.2287 | 0.2450 | 0.2713 |
| Pivot points | S3 | S2 | S1 | PP | R1 | R2 | R3 |
|---|---|---|---|---|---|---|---|
| Standard | 0.0993 | 0.1337 | 0.1693 | 0.2037 | 0.2393 | 0.2737 | 0.3093 |
| Camarilla | 0.1858 | 0.1922 | 0.1986 | 0.2050 | 0.2114 | 0.2178 | 0.2243 |
| Woodie | 0.1000 | 0.1340 | 0.1700 | 0.2040 | 0.2400 | 0.2740 | 0.3100 |
| Fibonacci | 0.1337 | 0.1604 | 0.1769 | 0.2037 | 0.2304 | 0.2469 | 0.2737 |
Numerical data
The following is the status of technical indicators and moving averages registered at the time this technical analysis was created:
| RSI (14): | 69.98 | |
| MACD (12,26,9): | 0.0052 | |
| Directional Movement: | 25.2531 | |
| AROON (14): | 21.4286 | |
| DEMA (21): | 0.1950 | |
| Parabolic SAR (0,02-0,02-0,2): | 0.1834 | |
| Elder Ray (13): | 0.0128 | |
| Super Trend (3,10): | 0.1867 | |
| Zig ZAG (10): | 0.2190 | |
| VORTEX (21): | 0.9197 | |
| Stochastique (14,3,5): | 48.79 | |
| TEMA (21): | 0.2024 | |
| Williams %R (14): | -27.54 | |
| Chande Momentum Oscillator (20): | 0.0445 | |
| Repulse (5,40,3): | 7.5300 | |
| ROCnROLL: | 1 | |
| TRIX (15,9): | 0.0646 | |
| Courbe Coppock: | 28.57 |
| MA7: | 0.2026 | |
| MA20: | 0.1835 | |
| MA50: | 0.1877 | |
| MA100: | 0.1974 | |
| MAexp7: | 0.1999 | |
| MAexp20: | 0.1899 | |
| MAexp50: | 0.1899 | |
| MAexp100: | 0.1949 | |
| Price / MA7: | +8.09% | |
| Price / MA20: | +19.35% | |
| Price / MA50: | +16.68% | |
| Price / MA100: | +10.94% | |
| Price / MAexp7: | +9.55% | |
| Price / MAexp20: | +15.32% | |
| Price / MAexp50: | +15.32% | |
| Price / MAexp100: | +12.37% |
News
The latest news and videos published on PROLOGUE at the time of the analysis were as follows:
- Stylish, Sporty, Spacious and All-Electric: Honda Prologue SUV Available Early Next Year with Anticipated EPA Range Rating of 300 Miles
- New Honda Prologue SUV Begins Next Chapter in Brand's EV Direction in North America
- Prologue - Retour de la croissance au Q4 2020 +1,9% (+3,0% à tcc)
- Prologue - Rapport Financier - Premier semestre 2020
- Date de publication du chiffre d'affaires 2018 avancée au 4 février 2019 après Bourse
About author
Online


Add a comment
Comments
0 comments on the analysis PROLOGUE - Daily