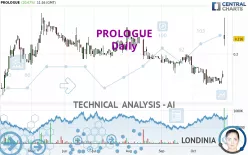
PROLOGUE - Daily - Technical analysis published on 10/30/2024 (GMT)
- 111
- 0
Click here for a new analysis!
- Timeframe : Daily
- - Analysis generated on
- Status : INVALID

Summary of the analysis

Additional analysis
Quotes
PROLOGUE rating 0.2160 EUR. The price has increased by +20.67% since the last closing and was traded between 0.2090 EUR and 0.2380 EUR over the period. The price is currently at +3.35% from its lowest and -9.24% from its highest.The Central Gaps scanner detects the formation of a bullish gap marking the strong presence of buyers against sellers at the opening. This formed a quotation gap.
Opening Gap UP
Type : Bullish
Timeframe : Openning
A study of price movements over other periods shows the following variations:
Near a new HIGH record (1st january)
Type : Bullish
Timeframe : Weekly
New HIGH record (1 month)
Type : Bullish
Timeframe : Weekly
Abnormal volumes on PROLOGUE were detected by the Central Volumes scanner:
Abnormal volumes
Timeframe : 5 days
Technical
Technical analysis of this Daily chart of PROLOGUE indicates that the overall trend is bullish. The signals returned by the moving averages are 71.43% bullish. This bullish trend is reinforced by the strong signals currently being given by short-term moving averages. An assessment of moving averages reveals several bullish signals that could impact this trend:
Bullish trend reversal : adaptative moving average 20
Type : Bullish
Timeframe : Daily
Bullish price crossover with Moving Average 50
Type : Bullish
Timeframe : Daily
Bullish price crossover with Moving Average 100
Type : Bullish
Timeframe : Daily
Bullish price crossover with adaptative moving average 20
Type : Bullish
Timeframe : Daily
Bullish price crossover with adaptative moving average 50
Type : Bullish
Timeframe : Daily
Bullish price crossover with adaptative moving average 100
Type : Bullish
Timeframe : Daily
In fact, 13 technical indicators on 18 studied are currently positioned bullish. But beware of excesses. The Central Indicators scanner currently detects this:
RSI indicator is overbought : over 70
Type : Neutral
Timeframe : Daily
CCI indicator is overbought : over 100
Type : Neutral
Timeframe : Daily
Pivot points : price is over resistance 3
Type : Neutral
Timeframe : Daily
Pivot points : price is over resistance 3
Type : Neutral
Timeframe : Weekly
Aroon indicator bullish trend
Type : Bullish
Timeframe : Daily
Ichimoku : price is over the cloud
Type : Bullish
Timeframe : Daily
SuperTrend indicator bullish reversal
Type : Bullish
Timeframe : Daily
MACD indicator is back over 0
Type : Bullish
Timeframe : Daily
Ichimoku - Bullish crossover : Tenkan & Kijun
Type : Bullish
Timeframe : Daily
An analysis of the price chart with the Central Patterns scanner (detector of chart patterns and resistances and supports) shows several results that can have an impact on the price change:
Horizontal resistance is broken
Type : Bullish
Timeframe : Daily
Resistance of channel is broken
Type : Bullish
Timeframe : Daily
From the Japanese candlestick perspective, the Central Candlesticks scanner notes the presence of these results that could impact the short-term trend:
Doji
Type : Neutral
Timeframe : Daily
Long black line
Type : Bearish
Timeframe : Daily
| S3 | S2 | S1 | Price | R1 | R2 | R3 | |
|---|---|---|---|---|---|---|---|
| ProTrendLines | 0.1760 | 0.1976 | 0.2080 | 0.2160 | 0.2200 | 0.2273 | 0.3277 |
| Change (%) | -18.52% | -8.52% | -3.70% | - | +1.85% | +5.23% | +51.71% |
| Change | -0.0400 | -0.0184 | -0.0080 | - | +0.0040 | +0.0113 | +0.1117 |
| Level | Major | Intermediate | Minor | - | Intermediate | Intermediate | Intermediate |
Attention could also be paid to pivot points to set price objectives:
| Pivot points | S3 | S2 | S1 | PP | R1 | R2 | R3 |
|---|---|---|---|---|---|---|---|
| Standard | 0.1677 | 0.1713 | 0.1752 | 0.1788 | 0.1827 | 0.1863 | 0.1902 |
| Camarilla | 0.1769 | 0.1776 | 0.1783 | 0.1790 | 0.1797 | 0.1804 | 0.1811 |
| Woodie | 0.1678 | 0.1714 | 0.1753 | 0.1789 | 0.1828 | 0.1864 | 0.1903 |
| Fibonacci | 0.1713 | 0.1742 | 0.1760 | 0.1788 | 0.1817 | 0.1835 | 0.1863 |
| Pivot points | S3 | S2 | S1 | PP | R1 | R2 | R3 |
|---|---|---|---|---|---|---|---|
| Standard | 0.1597 | 0.1643 | 0.1667 | 0.1713 | 0.1737 | 0.1783 | 0.1807 |
| Camarilla | 0.1671 | 0.1677 | 0.1684 | 0.1690 | 0.1696 | 0.1703 | 0.1709 |
| Woodie | 0.1585 | 0.1638 | 0.1655 | 0.1708 | 0.1725 | 0.1778 | 0.1795 |
| Fibonacci | 0.1643 | 0.1670 | 0.1687 | 0.1713 | 0.1740 | 0.1757 | 0.1783 |
| Pivot points | S3 | S2 | S1 | PP | R1 | R2 | R3 |
|---|---|---|---|---|---|---|---|
| Standard | 0.1597 | 0.1698 | 0.1792 | 0.1893 | 0.1987 | 0.2088 | 0.2182 |
| Camarilla | 0.1831 | 0.1849 | 0.1867 | 0.1885 | 0.1903 | 0.1921 | 0.1939 |
| Woodie | 0.1593 | 0.1696 | 0.1788 | 0.1891 | 0.1983 | 0.2086 | 0.2178 |
| Fibonacci | 0.1698 | 0.1773 | 0.1819 | 0.1893 | 0.1968 | 0.2014 | 0.2088 |
Numerical data
The following is the status of technical indicators and moving averages registered at the time this technical analysis was created:
| RSI (14): | 72.68 | |
| MACD (12,26,9): | -0.0008 | |
| Directional Movement: | 34.1678 | |
| AROON (14): | 85.7143 | |
| DEMA (21): | 0.1787 | |
| Parabolic SAR (0,02-0,02-0,2): | 0.1683 | |
| Elder Ray (13): | 0.0422 | |
| Super Trend (3,10): | 0.1877 | |
| Zig ZAG (10): | 0.2160 | |
| VORTEX (21): | 0.9613 | |
| Stochastique (14,3,5): | 53.16 | |
| TEMA (21): | 0.1819 | |
| Williams %R (14): | -31.43 | |
| Chande Momentum Oscillator (20): | 0.0475 | |
| Repulse (5,40,3): | -5.6471 | |
| ROCnROLL: | 1 | |
| TRIX (15,9): | -0.3410 | |
| Courbe Coppock: | 0.71 |
| MA7: | 0.1798 | |
| MA20: | 0.1788 | |
| MA50: | 0.1873 | |
| MA100: | 0.1980 | |
| MAexp7: | 0.1847 | |
| MAexp20: | 0.1814 | |
| MAexp50: | 0.1872 | |
| MAexp100: | 0.1942 | |
| Price / MA7: | +20.13% | |
| Price / MA20: | +20.81% | |
| Price / MA50: | +15.32% | |
| Price / MA100: | +9.09% | |
| Price / MAexp7: | +16.95% | |
| Price / MAexp20: | +19.07% | |
| Price / MAexp50: | +15.38% | |
| Price / MAexp100: | +11.23% |
News
The latest news and videos published on PROLOGUE at the time of the analysis were as follows:
- Stylish, Sporty, Spacious and All-Electric: Honda Prologue SUV Available Early Next Year with Anticipated EPA Range Rating of 300 Miles
- New Honda Prologue SUV Begins Next Chapter in Brand's EV Direction in North America
- Prologue - Retour de la croissance au Q4 2020 +1,9% (+3,0% à tcc)
- Prologue - Rapport Financier - Premier semestre 2020
- Date de publication du chiffre d'affaires 2018 avancée au 4 février 2019 après Bourse
About author
Online


Add a comment
Comments
0 comments on the analysis PROLOGUE - Daily