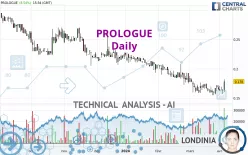
PROLOGUE - Daily - Technical analysis published on 04/06/2024 (GMT)
- 171
- 0
Click here for a new analysis!
- Timeframe : Daily
- - Analysis generated on
- Status : INVALID

Summary of the analysis

Additional analysis
Quotes
The PROLOGUE price is 0.1780 EUR. The price registered an increase of +8.54% on the session with the lowest point at 0.1610 EUR and the highest point at 0.1820 EUR. The deviation from the price is +10.56% for the low point and -2.20% for the high point.The Central Gaps scanner detects a bullish opening. A small advantage for buyers in the very short term.
Bullish opening
Type : Bullish
Timeframe : Openning
Here is a more detailed summary of the historical variations registered by PROLOGUE:
Near a new LOW record (5 years)
Type : Bearish
Timeframe : Weekly
Near a new LOW record (1 year)
Type : Bearish
Timeframe : Weekly
Near a new LOW record (1st january)
Type : Bearish
Timeframe : Weekly
New HIGH record (1 month)
Type : Bullish
Timeframe : Weekly
Technical
Technical analysis of PROLOGUE in Daily shows an overall bearish trend. The signals given by moving averages are 71.43% bearish. This bearish trend could slow down given the neutral signals currently being given by short-term moving averages. An assessment of moving averages reveals several bullish signals that could impact this trend:
Bullish price crossover with Moving Average 20
Type : Bullish
Timeframe : Daily
Bullish price crossover with adaptative moving average 20
Type : Bullish
Timeframe : Daily
Bullish price crossover with adaptative moving average 50
Type : Bullish
Timeframe : Daily
The technical indicators are bullish. There is still some doubt about the price increase.
But beware of excesses. The Central Indicators scanner currently detects this:
CCI indicator is overbought : over 100
Type : Neutral
Timeframe : Daily
Williams %R indicator is overbought : over -20
Type : Neutral
Timeframe : Daily
Pivot points : price is over resistance 1
Type : Neutral
Timeframe : Weekly
Pivot points : price is over resistance 3
Type : Neutral
Timeframe : Daily
RSI indicator is back over 50
Type : Bullish
Timeframe : Daily
Parabolic SAR indicator bullish reversal
Type : Bullish
Timeframe : Daily
Aroon indicator bullish trend
Type : Bullish
Timeframe : Daily
Momentum indicator is back over 0
Type : Bullish
Timeframe : Daily
An analysis of the price chart with the Central Patterns scanner (detector of chart patterns and resistances and supports) shows a result that can have an impact on the price change:
Near resistance of channel
Type : Bearish
Timeframe : Daily
No result was found by the Central Candlesticks scanner on Japanese candlesticks.
| S1 | Price | R1 | R2 | R3 | |
|---|---|---|---|---|---|
| ProTrendLines | 0.1615 | 0.1780 | 0.2245 | 0.2480 | 0.2679 |
| Change (%) | -9.27% | - | +26.12% | +39.33% | +50.51% |
| Change | -0.0165 | - | +0.0465 | +0.0700 | +0.0899 |
| Level | Major | - | Major | Minor | Intermediate |
Pivot points can also be used to set your price objectives. Here is the price situation in relation to pivot points:
| Pivot points | S3 | S2 | S1 | PP | R1 | R2 | R3 |
|---|---|---|---|---|---|---|---|
| Standard | 0.1443 | 0.1527 | 0.1653 | 0.1737 | 0.1863 | 0.1947 | 0.2073 |
| Camarilla | 0.1722 | 0.1742 | 0.1761 | 0.1780 | 0.1799 | 0.1819 | 0.1838 |
| Woodie | 0.1465 | 0.1538 | 0.1675 | 0.1748 | 0.1885 | 0.1958 | 0.2095 |
| Fibonacci | 0.1527 | 0.1607 | 0.1656 | 0.1737 | 0.1817 | 0.1866 | 0.1947 |
| Pivot points | S3 | S2 | S1 | PP | R1 | R2 | R3 |
|---|---|---|---|---|---|---|---|
| Standard | 0.1377 | 0.1473 | 0.1627 | 0.1723 | 0.1877 | 0.1973 | 0.2127 |
| Camarilla | 0.1711 | 0.1734 | 0.1757 | 0.1780 | 0.1803 | 0.1826 | 0.1849 |
| Woodie | 0.1405 | 0.1488 | 0.1655 | 0.1738 | 0.1905 | 0.1988 | 0.2155 |
| Fibonacci | 0.1473 | 0.1569 | 0.1628 | 0.1723 | 0.1819 | 0.1878 | 0.1973 |
| Pivot points | S3 | S2 | S1 | PP | R1 | R2 | R3 |
|---|---|---|---|---|---|---|---|
| Standard | 0.1183 | 0.1367 | 0.1508 | 0.1692 | 0.1833 | 0.2017 | 0.2158 |
| Camarilla | 0.1561 | 0.1590 | 0.1620 | 0.1650 | 0.1680 | 0.1710 | 0.1739 |
| Woodie | 0.1163 | 0.1356 | 0.1488 | 0.1681 | 0.1813 | 0.2006 | 0.2138 |
| Fibonacci | 0.1367 | 0.1491 | 0.1568 | 0.1692 | 0.1816 | 0.1893 | 0.2017 |
Numerical data
The following is the status of the technical indicators and moving averages at the time of publication of this technical analysis:
| RSI (14): | 56.08 | |
| MACD (12,26,9): | -0.0038 | |
| Directional Movement: | 5.3822 | |
| AROON (14): | 57.1429 | |
| DEMA (21): | 0.1630 | |
| Parabolic SAR (0,02-0,02-0,2): | 0.1550 | |
| Elder Ray (13): | 0.0038 | |
| Super Trend (3,10): | 0.1869 | |
| Zig ZAG (10): | 0.1780 | |
| VORTEX (21): | 1.0025 | |
| Stochastique (14,3,5): | 59.16 | |
| TEMA (21): | 0.1662 | |
| Williams %R (14): | -14.81 | |
| Chande Momentum Oscillator (20): | 0.0110 | |
| Repulse (5,40,3): | 11.1260 | |
| ROCnROLL: | -1 | |
| TRIX (15,9): | -0.4828 | |
| Courbe Coppock: | 1.14 |
| MA7: | 0.1679 | |
| MA20: | 0.1662 | |
| MA50: | 0.1823 | |
| MA100: | 0.2033 | |
| MAexp7: | 0.1682 | |
| MAexp20: | 0.1693 | |
| MAexp50: | 0.1814 | |
| MAexp100: | 0.1989 | |
| Price / MA7: | +6.02% | |
| Price / MA20: | +7.10% | |
| Price / MA50: | -2.36% | |
| Price / MA100: | -12.44% | |
| Price / MAexp7: | +5.83% | |
| Price / MAexp20: | +5.14% | |
| Price / MAexp50: | -1.87% | |
| Price / MAexp100: | -10.51% |
News
Don't forget to follow the news on PROLOGUE. At the time of publication of this analysis, the latest news was as follows:
- Stylish, Sporty, Spacious and All-Electric: Honda Prologue SUV Available Early Next Year with Anticipated EPA Range Rating of 300 Miles
- New Honda Prologue SUV Begins Next Chapter in Brand's EV Direction in North America
- Prologue - Retour de la croissance au Q4 2020 +1,9% (+3,0% à tcc)
- Prologue - Rapport Financier - Premier semestre 2020
- Date de publication du chiffre d'affaires 2018 avancée au 4 février 2019 après Bourse
About author

Online


Add a comment
Comments
0 comments on the analysis PROLOGUE - Daily