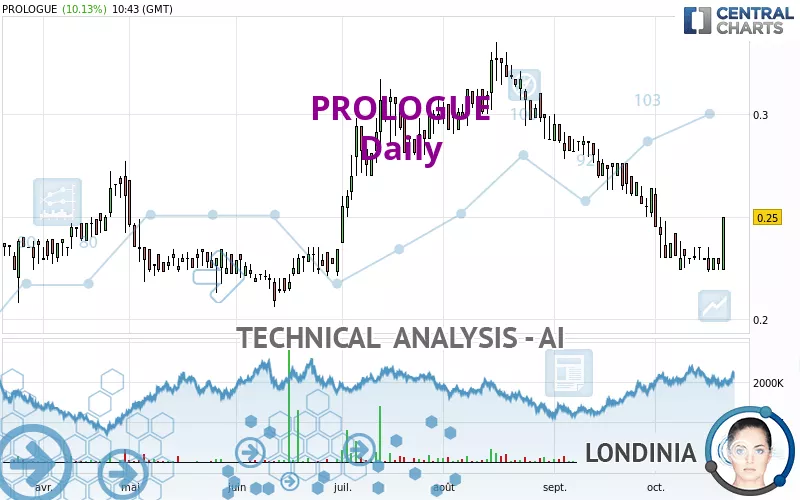
PROLOGUE - Daily - Technical analysis published on 10/20/2023 (GMT)
- 144
- 0
- Timeframe : Daily
- - Analysis generated on
- Status : NEUTRAL

Summary of the analysis

Additional analysis
Quotes
PROLOGUE rating 0.250 EUR. On the day, this instrument gained +10.13% and was traded between 0.224 EUR and 0.250 EUR over the period. The price is currently at +11.61% from its lowest and 0% from its highest.A bearish opening was detected by the Central Gaps scanner. Sellers are trying to impose a bearish trend in the very short term.
Bearish opening
Type : Bearish
Timeframe : Openning
Here is a more detailed summary of the historical variations registered by PROLOGUE:
Near a new LOW record (1 month)
Type : Bearish
Timeframe : Weekly
Technical
Technical analysis of PROLOGUE in Daily shows an overall slightly bearish trend. Only 60.71% of the signals given by moving averages are bearish. This slightly bearish trend could return to neutral given the neutral signals also given by short-term moving averages. The Central Indicators scanner detects bullish signals on moving averages that could impact this trend:
Bullish price crossover with Moving Average 20
Type : Bullish
Timeframe : Daily
Bullish price crossover with adaptative moving average 20
Type : Bullish
Timeframe : Daily
The probability of a further increase is slight given the direction of the technical indicators.
But beware of excesses. The Central Indicators scanner currently detects this:
Williams %R indicator is overbought : over -20
Type : Neutral
Timeframe : Daily
Pivot points : price is over resistance 2
Type : Neutral
Timeframe : Weekly
Pivot points : price is over resistance 3
Type : Neutral
Timeframe : Daily
RSI indicator is back over 50
Type : Bullish
Timeframe : Daily
Parabolic SAR indicator bullish reversal
Type : Bullish
Timeframe : Daily
Momentum indicator is back over 0
Type : Bullish
Timeframe : Daily
Central Patterns, the market scanner focusing on chart patterns, resistances and supports found this result:
Resistance of channel is broken
Type : Bullish
Timeframe : Daily
Central Candlesticks, the scanner specialised in Japanese candlesticks, detects a bullish signal that could support the hypothesis of a small rebound in the very short term:
Bullish engulfing lines
Type : Bullish
Timeframe : Daily
| S3 | S2 | S1 | Price | R1 | R2 | R3 | |
|---|---|---|---|---|---|---|---|
| ProTrendLines | 0.171 | 0.209 | 0.225 | 0.250 | 0.266 | 0.308 | 0.328 |
| Change (%) | -31.60% | -16.40% | -10.00% | - | +6.40% | +23.20% | +31.20% |
| Change | -0.079 | -0.041 | -0.025 | - | +0.016 | +0.058 | +0.078 |
| Level | Major | Minor | Major | - | Intermediate | Minor | Major |
Attention could also be paid to pivot points to set price objectives:
| Pivot points | S3 | S2 | S1 | PP | R1 | R2 | R3 |
|---|---|---|---|---|---|---|---|
| Standard | 0.218 | 0.221 | 0.224 | 0.227 | 0.230 | 0.233 | 0.236 |
| Camarilla | 0.225 | 0.226 | 0.227 | 0.227 | 0.228 | 0.228 | 0.229 |
| Woodie | 0.218 | 0.221 | 0.224 | 0.227 | 0.230 | 0.233 | 0.236 |
| Fibonacci | 0.221 | 0.223 | 0.225 | 0.227 | 0.229 | 0.231 | 0.233 |
| Pivot points | S3 | S2 | S1 | PP | R1 | R2 | R3 |
|---|---|---|---|---|---|---|---|
| Standard | 0.213 | 0.218 | 0.227 | 0.232 | 0.241 | 0.246 | 0.255 |
| Camarilla | 0.231 | 0.232 | 0.234 | 0.235 | 0.236 | 0.238 | 0.239 |
| Woodie | 0.214 | 0.219 | 0.228 | 0.233 | 0.242 | 0.247 | 0.256 |
| Fibonacci | 0.218 | 0.224 | 0.227 | 0.232 | 0.238 | 0.241 | 0.246 |
| Pivot points | S3 | S2 | S1 | PP | R1 | R2 | R3 |
|---|---|---|---|---|---|---|---|
| Standard | 0.193 | 0.221 | 0.243 | 0.271 | 0.293 | 0.321 | 0.343 |
| Camarilla | 0.250 | 0.255 | 0.259 | 0.264 | 0.269 | 0.273 | 0.278 |
| Woodie | 0.189 | 0.220 | 0.239 | 0.270 | 0.289 | 0.320 | 0.339 |
| Fibonacci | 0.221 | 0.240 | 0.252 | 0.271 | 0.290 | 0.302 | 0.321 |
Numerical data
The following are the details of the technical indicators and moving averages that were collected to generate this technical analysis:
| RSI (14): | 51.50 | |
| MACD (12,26,9): | -0.0110 | |
| Directional Movement: | 2.017 | |
| AROON (14): | -78.571 | |
| DEMA (21): | 0.227 | |
| Parabolic SAR (0,02-0,02-0,2): | 0.223 | |
| Elder Ray (13): | 0 | |
| Super Trend (3,10): | 0.255 | |
| Zig ZAG (10): | 0.250 | |
| VORTEX (21): | 0.8010 | |
| Stochastique (14,3,5): | 42.28 | |
| TEMA (21): | 0.226 | |
| Williams %R (14): | 0.00 | |
| Chande Momentum Oscillator (20): | 0.020 | |
| Repulse (5,40,3): | 13.5640 | |
| ROCnROLL: | -1 | |
| TRIX (15,9): | -0.7430 | |
| Courbe Coppock: | 15.21 |
| MA7: | 0.232 | |
| MA20: | 0.240 | |
| MA50: | 0.272 | |
| MA100: | 0.269 | |
| MAexp7: | 0.235 | |
| MAexp20: | 0.242 | |
| MAexp50: | 0.259 | |
| MAexp100: | 0.262 | |
| Price / MA7: | +7.76% | |
| Price / MA20: | +4.17% | |
| Price / MA50: | -8.09% | |
| Price / MA100: | -7.06% | |
| Price / MAexp7: | +6.38% | |
| Price / MAexp20: | +3.31% | |
| Price / MAexp50: | -3.47% | |
| Price / MAexp100: | -4.58% |
News
The last news published on PROLOGUE at the time of the generation of this analysis was as follows:
- Stylish, Sporty, Spacious and All-Electric: Honda Prologue SUV Available Early Next Year with Anticipated EPA Range Rating of 300 Miles
- New Honda Prologue SUV Begins Next Chapter in Brand's EV Direction in North America
- Prologue - Retour de la croissance au Q4 2020 +1,9% (+3,0% à tcc)
- Prologue - Rapport Financier - Premier semestre 2020
- Date de publication du chiffre d'affaires 2018 avancée au 4 février 2019 après Bourse
About author
Online


Add a comment
Comments
0 comments on the analysis PROLOGUE - Daily