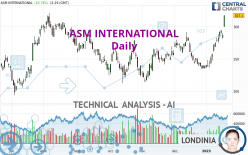
ASM INTERNATIONAL - Daily - Technical analysis published on 01/18/2023 (GMT)
- 159
- 0
Click here for a new analysis!
- Timeframe : Daily
- - Analysis generated on
- Status : INVALID

Summary of the analysis

Additional analysis
Quotes
The ASM INTERNATIONAL rating is 317.15 EUR. The price has increased by +10.76% since the last closing and was between 300.00 EUR and 317.55 EUR. This implies that the price is at +5.72% from its lowest and at -0.13% from its highest.A bullish gap was detected at the opening by the Central Gaps scanner. There are a lot of buyers and they have the upper hand in the very short term.
Opening Gap UP
Type : Bullish
Timeframe : Openning
A study of price movements over other periods shows the following variations:
New HIGH record (1st january)
Type : Bullish
Timeframe : Weekly
New HIGH record (1 month)
Type : Bullish
Timeframe : Weekly
Technical
Technical analysis of ASM INTERNATIONAL in Daily shows a strongly overall bullish trend. 92.86% of the signals given by moving averages are bullish. This strongly bullish trend is supported by the strong bullish signals given by short-term moving averages. The Central Indicators scanner detects a bullish signal on moving averages that could impact this trend:
Moving Average bullish crossovers : MA20 & MA50
Type : Bullish
Timeframe : Daily
In fact, 17 technical indicators on 18 studied are currently positioned bullish. But beware of excesses. The Central Indicators scanner currently detects this:
RSI indicator is overbought : over 70
Type : Neutral
Timeframe : Daily
CCI indicator is overbought : over 100
Type : Neutral
Timeframe : Daily
Williams %R indicator is overbought : over -20
Type : Neutral
Timeframe : Daily
Pivot points : price is over resistance 2
Type : Neutral
Timeframe : Weekly
Pivot points : price is over resistance 3
Type : Neutral
Timeframe : Daily
The Central Patterns scanner, which studies chart patterns, resistances and supports, has identified these signals:
Horizontal resistance is broken
Type : Bullish
Timeframe : Daily
Resistance of channel is broken
Type : Bullish
Timeframe : Daily
For a small rebound in the very short term, the Central Candlesticks scanner currently notes the presence of this bullish pattern in Japanese candlesticks:
Upside gap
Type : Bullish
Timeframe : Daily
| S3 | S2 | S1 | Price | R1 | R2 | |
|---|---|---|---|---|---|---|
| ProTrendLines | 283.63 | 299.40 | 315.45 | 317.15 | 392.83 | 430.90 |
| Change (%) | -10.57% | -5.60% | -0.54% | - | +23.86% | +35.87% |
| Change | -33.52 | -17.75 | -1.70 | - | +75.68 | +113.75 |
| Level | Major | Minor | Major | - | Minor | Major |
Attention could also be paid to pivot points to set price objectives:
| Pivot points | S3 | S2 | S1 | PP | R1 | R2 | R3 |
|---|---|---|---|---|---|---|---|
| Standard | 272.97 | 277.08 | 281.72 | 285.83 | 290.47 | 294.58 | 299.22 |
| Camarilla | 283.94 | 284.75 | 285.55 | 286.35 | 287.15 | 287.95 | 288.76 |
| Woodie | 273.23 | 277.21 | 281.98 | 285.96 | 290.73 | 294.71 | 299.48 |
| Fibonacci | 277.08 | 280.43 | 282.49 | 285.83 | 289.18 | 291.24 | 294.58 |
| Pivot points | S3 | S2 | S1 | PP | R1 | R2 | R3 |
|---|---|---|---|---|---|---|---|
| Standard | 239.12 | 249.93 | 270.87 | 281.68 | 302.62 | 313.43 | 334.37 |
| Camarilla | 283.07 | 285.98 | 288.89 | 291.80 | 294.71 | 297.62 | 300.53 |
| Woodie | 244.18 | 252.46 | 275.93 | 284.21 | 307.68 | 315.96 | 339.43 |
| Fibonacci | 249.93 | 262.06 | 269.56 | 281.68 | 293.81 | 301.31 | 313.43 |
| Pivot points | S3 | S2 | S1 | PP | R1 | R2 | R3 |
|---|---|---|---|---|---|---|---|
| Standard | 157.95 | 195.95 | 215.80 | 253.80 | 273.65 | 311.65 | 331.50 |
| Camarilla | 219.74 | 225.04 | 230.35 | 235.65 | 240.95 | 246.26 | 251.56 |
| Woodie | 148.88 | 191.41 | 206.73 | 249.26 | 264.58 | 307.11 | 322.43 |
| Fibonacci | 195.95 | 218.05 | 231.70 | 253.80 | 275.90 | 289.55 | 311.65 |
Numerical data
The following is the status of technical indicators and moving averages registered at the time this technical analysis was created:
| RSI (14): | 77.27 | |
| MACD (12,26,9): | 11.7200 | |
| Directional Movement: | 31.85 | |
| AROON (14): | 100.00 | |
| DEMA (21): | 283.53 | |
| Parabolic SAR (0,02-0,02-0,2): | 267.21 | |
| Elder Ray (13): | 30.63 | |
| Super Trend (3,10): | 274.00 | |
| Zig ZAG (10): | 317.50 | |
| VORTEX (21): | 1.1500 | |
| Stochastique (14,3,5): | 93.61 | |
| TEMA (21): | 293.60 | |
| Williams %R (14): | -0.61 | |
| Chande Momentum Oscillator (20): | 79.40 | |
| Repulse (5,40,3): | 9.2400 | |
| ROCnROLL: | 1 | |
| TRIX (15,9): | 0.2600 | |
| Courbe Coppock: | 40.28 |
| MA7: | 288.64 | |
| MA20: | 260.35 | |
| MA50: | 259.93 | |
| MA100: | 255.59 | |
| MAexp7: | 289.51 | |
| MAexp20: | 271.22 | |
| MAexp50: | 261.81 | |
| MAexp100: | 260.57 | |
| Price / MA7: | +9.88% | |
| Price / MA20: | +21.82% | |
| Price / MA50: | +22.01% | |
| Price / MA100: | +24.09% | |
| Price / MAexp7: | +9.55% | |
| Price / MAexp20: | +16.93% | |
| Price / MAexp50: | +21.14% | |
| Price / MAexp100: | +21.71% |
News
The latest news and videos published on ASM INTERNATIONAL at the time of the analysis were as follows:
- ASM ANNOUNCES Q4 2022 REVENUE ABOVE GUIDANCE, DRIVEN BY SUPPLY CHAIN IMPROVEMENT
- ASM UPDATES Q4 GUIDANCE
- ASM INTERNATIONAL N.V. REPORTS THIRD QUARTER 2022 RESULTS
- ASM COMPLETES ACQUISITION OF LPE
- ASM INTERNATIONAL N.V. REPORTS SECOND QUARTER 2022 RESULTS
About author
Online


Add a comment
Comments
0 comments on the analysis ASM INTERNATIONAL - Daily