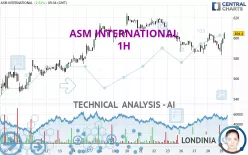
ASM INTERNATIONAL - 1H - Technical analysis published on 08/29/2024 (GMT)
- 139
- 0
Click here for a new analysis!
- Timeframe : 1H
- - Analysis generated on
- Status : LEVEL MAINTAINED

Summary of the analysis

Additional analysis
Quotes
The ASM INTERNATIONAL price is 604.4 EUR. The price registered an increase of +2.62% on the session with the lowest point at 583.0 EUR and the highest point at 605.6 EUR. The deviation from the price is +3.67% for the low point and -0.20% for the high point.A bearish gap was detected at the opening by the Central Gaps scanner. There are a lot of sellers and they have the upper hand in the very short term.
Opening Gap DOWN
Type : Bearish
Timeframe : Openning
A study of price movements over other periods shows the following variations:
Technical
A technical analysis in 1H of this ASM INTERNATIONAL chart shows a bullish trend. 64.29% of the signals given by moving averages are bullish. This bullish trend is supported by the strong bullish signals given by short-term moving averages. An assessment of moving averages reveals several bullish signals that could impact this trend:
Bullish trend reversal : adaptative moving average 50
Type : Bullish
Timeframe : 1 hour
Bullish trend reversal : adaptative moving average 100
Type : Bullish
Timeframe : 1 hour
Bullish price crossover with Moving Average 50
Type : Bullish
Timeframe : 1 hour
Bullish price crossover with Moving Average 100
Type : Bullish
Timeframe : 1 hour
Bullish price crossover with adaptative moving average 50
Type : Bullish
Timeframe : 1 hour
Bullish price crossover with adaptative moving average 100
Type : Bullish
Timeframe : 1 hour
The technical indicators are bullish. There is still some doubt about the price increase.
But beware of excesses. The Central Indicators scanner currently detects this:
CCI indicator is overbought : over 100
Type : Neutral
Timeframe : 1 hour
Williams %R indicator is overbought : over -20
Type : Neutral
Timeframe : 1 hour
Pivot points : price is over resistance 1
Type : Neutral
Timeframe : 1 hour
Parabolic SAR indicator bullish reversal
Type : Bullish
Timeframe : 1 hour
Aroon indicator bullish trend
Type : Bullish
Timeframe : 1 hour
SuperTrend indicator bullish reversal
Type : Bullish
Timeframe : 1 hour
MACD indicator is back over 0
Type : Bullish
Timeframe : 1 hour
The Central Patterns scanner, which studies chart patterns, resistances and supports, has identified this signal:
Near support of triangle
Type : Bullish
Timeframe : 1 hour
The Central Candlesticks scanner, specialised in Japanese candlesticks, did not identify any signals.
| S3 | S2 | S1 | Price | R1 | R2 | R3 | |
|---|---|---|---|---|---|---|---|
| ProTrendLines | 513.1 | 545.8 | 597.5 | 604.4 | 624.5 | 640.2 | 660.6 |
| Change (%) | -15.11% | -9.70% | -1.14% | - | +3.33% | +5.92% | +9.30% |
| Change | -91.3 | -58.6 | -6.9 | - | +20.1 | +35.8 | +56.2 |
| Level | Major | Major | Major | - | Intermediate | Intermediate | Minor |
Pivot points can also be used to set your price objectives. Here is the price situation in relation to pivot points:
| Pivot points | S3 | S2 | S1 | PP | R1 | R2 | R3 |
|---|---|---|---|---|---|---|---|
| Standard | 564.7 | 575.9 | 582.5 | 593.7 | 600.3 | 611.5 | 618.1 |
| Camarilla | 584.1 | 585.7 | 587.4 | 589.0 | 590.6 | 592.3 | 593.9 |
| Woodie | 562.3 | 574.8 | 580.1 | 592.6 | 597.9 | 610.4 | 615.7 |
| Fibonacci | 575.9 | 582.7 | 586.9 | 593.7 | 600.5 | 604.7 | 611.5 |
| Pivot points | S3 | S2 | S1 | PP | R1 | R2 | R3 |
|---|---|---|---|---|---|---|---|
| Standard | 560.7 | 578.1 | 589.7 | 607.1 | 618.7 | 636.1 | 647.7 |
| Camarilla | 593.2 | 595.9 | 598.5 | 601.2 | 603.9 | 606.5 | 609.2 |
| Woodie | 557.7 | 576.7 | 586.7 | 605.7 | 615.7 | 634.7 | 644.7 |
| Fibonacci | 578.1 | 589.2 | 596.1 | 607.1 | 618.2 | 625.1 | 636.1 |
| Pivot points | S3 | S2 | S1 | PP | R1 | R2 | R3 |
|---|---|---|---|---|---|---|---|
| Standard | 407.1 | 498.1 | 565.9 | 656.9 | 724.7 | 815.7 | 883.5 |
| Camarilla | 589.9 | 604.5 | 619.0 | 633.6 | 648.2 | 662.7 | 677.3 |
| Woodie | 395.4 | 492.3 | 554.2 | 651.1 | 713.0 | 809.9 | 871.8 |
| Fibonacci | 498.1 | 558.8 | 596.3 | 656.9 | 717.6 | 755.1 | 815.7 |
Numerical data
The following are the details of the technical indicators and moving averages that were collected to generate this technical analysis:
| RSI (14): | 58.60 | |
| MACD (12,26,9): | 0.0000 | |
| Directional Movement: | 7.4 | |
| AROON (14): | -57.1 | |
| DEMA (21): | 595.5 | |
| Parabolic SAR (0,02-0,02-0,2): | 583.0 | |
| Elder Ray (13): | 5.6 | |
| Super Trend (3,10): | 585.5 | |
| Zig ZAG (10): | 603.6 | |
| VORTEX (21): | 1.0000 | |
| Stochastique (14,3,5): | 74.50 | |
| TEMA (21): | 597.7 | |
| Williams %R (14): | -2.70 | |
| Chande Momentum Oscillator (20): | 11.4 | |
| Repulse (5,40,3): | 2.5000 | |
| ROCnROLL: | 1 | |
| TRIX (15,9): | 0.0000 | |
| Courbe Coppock: | 2.00 |
| MA7: | 601.0 | |
| MA20: | 584.9 | |
| MA50: | 644.6 | |
| MA100: | 638.4 | |
| MAexp7: | 597.7 | |
| MAexp20: | 596.0 | |
| MAexp50: | 597.8 | |
| MAexp100: | 598.0 | |
| Price / MA7: | +0.57% | |
| Price / MA20: | +3.33% | |
| Price / MA50: | -6.24% | |
| Price / MA100: | -5.33% | |
| Price / MAexp7: | +1.12% | |
| Price / MAexp20: | +1.41% | |
| Price / MAexp50: | +1.10% | |
| Price / MAexp100: | +1.07% |
News
Don't forget to follow the news on ASM INTERNATIONAL. At the time of publication of this analysis, the latest news was as follows:
- ASM announces completion of share buyback program
- ASM announces second quarter 2024 results
- ASM share buyback update July 15 – 19, 2024
- ASM share buyback update July 8 – 12, 2024
- ASM share buyback update July 1 – 5, 2024
About author
Online


Add a comment
Comments
0 comments on the analysis ASM INTERNATIONAL - 1H