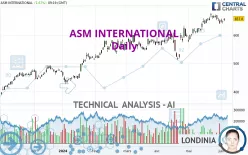
ASM INTERNATIONAL - Daily - Technical analysis published on 06/05/2024 (GMT)
- 173
- 0
Click here for a new analysis!
- Timeframe : Daily
- - Analysis generated on
- Status : TARGET REACHED

Summary of the analysis

Additional analysis
Quotes
ASM INTERNATIONAL rating 657.8 EUR. On the day, this instrument gained +1.67% with the lowest point at 649.4 EUR and the highest point at 659.4 EUR. The deviation from the price is +1.29% for the low point and -0.24% for the high point.A bullish gap was detected at the opening by the Central Gaps scanner. There are a lot of buyers and they have the upper hand in the very short term.
Opening Gap UP
Type : Bullish
Timeframe : Openning
A study of price movements over other periods shows the following variations:
Near a new HIGH record (5 years)
Type : Bullish
Timeframe : Weekly
Near a new HIGH record (1 year)
Type : Bullish
Timeframe : Weekly
Near a new HIGH record (1st january)
Type : Bullish
Timeframe : Weekly
Near a new HIGH record (1 month)
Type : Bullish
Timeframe : Weekly
Technical
A technical analysis in Daily of this ASM INTERNATIONAL chart shows a strongly bullish trend. 92.86% of the signals given by moving averages are bullish. The overall trend is supported by the strong bullish signals from short-term moving averages. The Central Indicators scanner does not detect any result on moving averages that would impact this trend.
In fact, Central Analyzer took into account 18 technical indicators and the result was as follows: 5 are bullish, 7 are neutral and 6 are bearish. Central Indicators, the detector scanner for these technical indicators has recently detected several signals:
Pivot points : price is over resistance 1
Type : Neutral
Timeframe : Daily
Momentum indicator is back over 0
Type : Bullish
Timeframe : Daily
The analysis of the price chart with Central Patterns scanners does not return any result.
The Central Candlesticks scanner which studies Japanese candlesticks did not detect anything.
| S3 | S2 | S1 | Price | R1 | |
|---|---|---|---|---|---|
| ProTrendLines | 425.8 | 513.1 | 597.5 | 657.8 | 673.8 |
| Change (%) | -35.27% | -22.00% | -9.17% | - | +2.43% |
| Change | -232.0 | -144.7 | -60.3 | - | +16.0 |
| Level | Major | Major | Intermediate | - | Major |
To determine price objectives, it is also possible to use the pivot points. Here is the price position in relation to pivot points:
| Pivot points | S3 | S2 | S1 | PP | R1 | R2 | R3 |
|---|---|---|---|---|---|---|---|
| Standard | 629.5 | 634.9 | 640.9 | 646.3 | 652.3 | 657.7 | 663.7 |
| Camarilla | 643.9 | 644.9 | 646.0 | 647.0 | 648.1 | 649.1 | 650.1 |
| Woodie | 629.9 | 635.1 | 641.3 | 646.5 | 652.7 | 657.9 | 664.1 |
| Fibonacci | 634.9 | 639.2 | 641.9 | 646.3 | 650.6 | 653.3 | 657.7 |
| Pivot points | S3 | S2 | S1 | PP | R1 | R2 | R3 |
|---|---|---|---|---|---|---|---|
| Standard | 597.0 | 618.6 | 629.4 | 651.0 | 661.8 | 683.4 | 694.2 |
| Camarilla | 631.3 | 634.3 | 637.2 | 640.2 | 643.2 | 646.1 | 649.1 |
| Woodie | 591.6 | 615.9 | 624.0 | 648.3 | 656.4 | 680.7 | 688.8 |
| Fibonacci | 618.6 | 631.0 | 638.6 | 651.0 | 663.4 | 671.0 | 683.4 |
| Pivot points | S3 | S2 | S1 | PP | R1 | R2 | R3 |
|---|---|---|---|---|---|---|---|
| Standard | 477.7 | 525.1 | 582.7 | 630.1 | 687.7 | 735.1 | 792.7 |
| Camarilla | 611.3 | 621.0 | 630.6 | 640.2 | 649.8 | 659.5 | 669.1 |
| Woodie | 482.7 | 527.7 | 587.7 | 632.7 | 692.7 | 737.7 | 797.7 |
| Fibonacci | 525.1 | 565.2 | 590.0 | 630.1 | 670.2 | 695.0 | 735.1 |
Numerical data
The following is the status of the technical indicators and moving averages at the time of publication of this technical analysis:
| RSI (14): | 60.40 | |
| MACD (12,26,9): | 14.3000 | |
| Directional Movement: | 11.9 | |
| AROON (14): | 28.6 | |
| DEMA (21): | 663.3 | |
| Parabolic SAR (0,02-0,02-0,2): | 675.4 | |
| Elder Ray (13): | 4.9 | |
| Super Trend (3,10): | 618.8 | |
| Zig ZAG (10): | 657.2 | |
| VORTEX (21): | 1.1000 | |
| Stochastique (14,3,5): | 38.40 | |
| TEMA (21): | 662.8 | |
| Williams %R (14): | -53.40 | |
| Chande Momentum Oscillator (20): | 2.0 | |
| Repulse (5,40,3): | -0.8000 | |
| ROCnROLL: | 1 | |
| TRIX (15,9): | 0.4000 | |
| Courbe Coppock: | 6.40 |
| MA7: | 652.2 | |
| MA20: | 647.1 | |
| MA50: | 605.4 | |
| MA100: | 574.2 | |
| MAexp7: | 652.1 | |
| MAexp20: | 642.5 | |
| MAexp50: | 613.0 | |
| MAexp100: | 575.5 | |
| Price / MA7: | +0.86% | |
| Price / MA20: | +1.65% | |
| Price / MA50: | +8.66% | |
| Price / MA100: | +14.56% | |
| Price / MAexp7: | +0.87% | |
| Price / MAexp20: | +2.38% | |
| Price / MAexp50: | +7.31% | |
| Price / MAexp100: | +14.30% |
News
Don't forget to follow the news on ASM INTERNATIONAL. At the time of publication of this analysis, the latest news was as follows:
- ASM share buyback update May 27 – 31, 2024
- ASM share buyback update May 20 – 24, 2024
- ASM share buyback update May 15 – 17, 2024
- ASM announces start of €150 million share buyback program
- ASM reports first quarter 2024
About author
Online


Add a comment
Comments
0 comments on the analysis ASM INTERNATIONAL - Daily