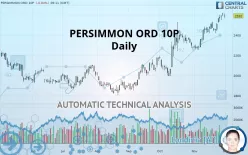
PERSIMMON ORD 10P - Daily - Technical analysis published on 11/29/2019 (GMT)
- 343
- 0
- Who voted?
Click here for a new analysis!
- Timeframe : Daily
- - Analysis generated on
- Status : TARGET REACHED

Summary of the analysis

Additional analysis
Quotes
PERSIMMON ORD 10P rating 2,592 GBX. The price is lower by -0.84% since the last closing with the lowest point at 2,569 GBX and the highest point at 2,613 GBX. The deviation from the price is +0.90% for the low point and -0.80% for the high point.The Central Gaps scanner detects a bearish opening. A small advantage for sellers in the very short term.
Bearish opening
Type : Bearish
Timeframe : Openning
So that you have an overall view of the price change, here is a table showing the variations over several periods:
New HIGH record (5 years)
Type : Bullish
Timeframe : Weekly
Near a new HIGH record (1st january)
Type : Bullish
Timeframe : Weekly
Near a new HIGH record (1 month)
Type : Bullish
Timeframe : Weekly
Technical
A technical analysis in Daily of this PERSIMMON ORD 10P chart shows a strongly bullish trend. 92.86% of the signals given by moving averages are bullish. The overall trend is supported by the strong bullish signals from short-term moving averages. The Central Indicators market scanner currently does not detect any result that concerns moving averages.
The probability of a further increase are moderate given the direction of the technical indicators.
But beware of excesses. The Central Indicators scanner currently detects this:
RSI indicator is overbought : over 70
Type : Neutral
Timeframe : Daily
CCI indicator is overbought : over 100
Type : Neutral
Timeframe : Daily
Williams %R indicator is overbought : over -20
Type : Neutral
Timeframe : Daily
Pivot points : price is over resistance 1
Type : Neutral
Timeframe : Weekly
Pivot points : price is under support 1
Type : Neutral
Timeframe : Daily
Price is back over the pivot point
Type : Bullish
Timeframe : Daily
An analysis of the price chart with the Central Patterns scanner (detector of chart patterns and resistances and supports) shows several results that can have an impact on the price change:
Near horizontal resistance
Type : Bearish
Timeframe : Daily
Resistance of channel is broken
Type : Bullish
Timeframe : Daily
The Central Candlesticks scanner which studies Japanese candlesticks did not detect anything.
| S3 | S2 | S1 | Price | R1 | R2 | |
|---|---|---|---|---|---|---|
| ProTrendLines | 2,219 | 2,350 | 2,471 | 2,592 | 2,654 | 2,887 |
| Change (%) | -14.39% | -9.34% | -4.67% | - | +2.39% | +11.38% |
| Change | -373 | -242 | -121 | - | +62 | +295 |
| Level | Major | Intermediate | Major | - | Minor | Intermediate |
Pivot points can also be used to set your price objectives. Here is the price situation in relation to pivot points:
| Pivot points | S3 | S2 | S1 | PP | R1 | R2 | R3 |
|---|---|---|---|---|---|---|---|
| Standard | 2,563 | 2,575 | 2,595 | 2,607 | 2,627 | 2,639 | 2,659 |
| Camarilla | 2,605 | 2,608 | 2,611 | 2,614 | 2,617 | 2,620 | 2,623 |
| Woodie | 2,566 | 2,577 | 2,598 | 2,609 | 2,630 | 2,641 | 2,662 |
| Fibonacci | 2,575 | 2,588 | 2,595 | 2,607 | 2,620 | 2,627 | 2,639 |
| Pivot points | S3 | S2 | S1 | PP | R1 | R2 | R3 |
|---|---|---|---|---|---|---|---|
| Standard | 2,330 | 2,375 | 2,444 | 2,489 | 2,558 | 2,603 | 2,672 |
| Camarilla | 2,482 | 2,492 | 2,503 | 2,513 | 2,523 | 2,534 | 2,544 |
| Woodie | 2,342 | 2,381 | 2,456 | 2,495 | 2,570 | 2,609 | 2,684 |
| Fibonacci | 2,375 | 2,419 | 2,446 | 2,489 | 2,533 | 2,560 | 2,603 |
| Pivot points | S3 | S2 | S1 | PP | R1 | R2 | R3 |
|---|---|---|---|---|---|---|---|
| Standard | 1,462 | 1,726 | 2,001 | 2,265 | 2,541 | 2,805 | 3,080 |
| Camarilla | 2,129 | 2,178 | 2,228 | 2,277 | 2,327 | 2,376 | 2,425 |
| Woodie | 1,468 | 1,729 | 2,007 | 2,268 | 2,547 | 2,808 | 3,086 |
| Fibonacci | 1,726 | 1,932 | 2,059 | 2,265 | 2,471 | 2,599 | 2,805 |
Numerical data
The following are the details of the technical indicators and moving averages that were collected to generate this technical analysis:
| RSI (14): | 69.00 | |
| MACD (12,26,9): | 81.0000 | |
| Directional Movement: | 21 | |
| AROON (14): | 93 | |
| DEMA (21): | 2,582 | |
| Parabolic SAR (0,02-0,02-0,2): | 2,419 | |
| Elder Ray (13): | 71 | |
| Super Trend (3,10): | 2,431 | |
| Zig ZAG (10): | 2,588 | |
| VORTEX (21): | 1.0000 | |
| Stochastique (14,3,5): | 94.00 | |
| TEMA (21): | 2,600 | |
| Williams %R (14): | -14.00 | |
| Chande Momentum Oscillator (20): | 123 | |
| Repulse (5,40,3): | 2.0000 | |
| ROCnROLL: | 1 | |
| TRIX (15,9): | 0.0000 | |
| Courbe Coppock: | 16.00 |
| MA7: | 2,555 | |
| MA20: | 2,458 | |
| MA50: | 2,318 | |
| MA100: | 2,137 | |
| MAexp7: | 2,559 | |
| MAexp20: | 2,478 | |
| MAexp50: | 2,340 | |
| MAexp100: | 2,215 | |
| Price / MA7: | +1.45% | |
| Price / MA20: | +5.45% | |
| Price / MA50: | +11.82% | |
| Price / MA100: | +21.29% | |
| Price / MAexp7: | +1.29% | |
| Price / MAexp20: | +4.60% | |
| Price / MAexp50: | +10.77% | |
| Price / MAexp100: | +17.02% |
News
The last news published on PERSIMMON ORD 10P at the time of the generation of this analysis was as follows:
 Persimmon
About author

Online


Add a comment
Comments
0 comments on the analysis PERSIMMON ORD 10P - Daily