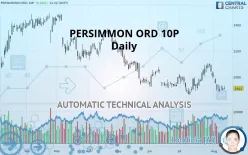
PERSIMMON ORD 10P - Daily - Technical analysis published on 08/12/2019 (GMT)
- 335
- 0
- Who voted?
Click here for a new analysis!
- Timeframe : Daily
- - Analysis generated on
- Status : TARGET REACHED

Summary of the analysis

Additional analysis
Quotes
PERSIMMON ORD 10P rating 1,912.0 GBX. The price has increased by +0.69% since the last closing and was traded between 1,905.5 GBX and 1,931.5 GBX over the period. The price is currently at +0.34% from its lowest and -1.01% from its highest.A bullish opening was detected by the Central Gaps scanner. Buyers are trying to impose a bullish momentum in the very short term.
Bullish opening
Type : Bullish
Timeframe : Openning
Here is a more detailed summary of the historical variations registered by PERSIMMON ORD 10P:
Near a new LOW record (1 month)
Type : Bearish
Timeframe : Weekly
Technical
Technical analysis of PERSIMMON ORD 10P in Daily shows a overall strongly bearish trend. The signals given by moving averages are 82.14% bearish. This strong bearish trend is confirmed by the strong signals currently being given by short-term moving averages. An assessment of moving averages reveals a bearish signal that could impact this trend:
Bearish trend reversal : Moving Average 20
Type : Bearish
Timeframe : Daily
The technical indicators are generally neutral. They do not provide relevant information on the direction of future price movements.
Caution: the Central Indicators scanner currently detects an excess:
Williams %R indicator is oversold : under -80
Type : Neutral
Timeframe : Daily
Price is back under the pivot point
Type : Bearish
Timeframe : Daily
Price is back under the pivot point
Type : Bearish
Timeframe : Weekly
The Central Patterns scanner, which studies chart patterns, resistances and supports, has identified this signal:
Near support of channel
Type : Bullish
Timeframe : Daily
Central Candlesticks, the scanner specialised in Japanese candlesticks, detects a bearish signal that could support the hypothesis of a small drop in the very short term:
Black evening star
Type : Bearish
Timeframe : Daily
| S3 | S2 | S1 | Price | R1 | R2 | R3 | |
|---|---|---|---|---|---|---|---|
| ProTrendLines | 1,543.0 | 1,663.8 | 1,859.5 | 1,912.0 | 1,994.6 | 2,138.0 | 2,219.0 |
| Change (%) | -19.30% | -12.98% | -2.75% | - | +4.32% | +11.82% | +16.06% |
| Change | -369.0 | -248.2 | -52.5 | - | +82.6 | +226.0 | +307.0 |
| Level | Major | Minor | Major | - | Intermediate | Minor | Intermediate |
Pivot points can also be used to set your price objectives. Here is the price situation in relation to pivot points:
| Pivot points | S3 | S2 | S1 | PP | R1 | R2 | R3 |
|---|---|---|---|---|---|---|---|
| Standard | 1,853.2 | 1,875.3 | 1,887.2 | 1,909.3 | 1,921.2 | 1,943.3 | 1,955.2 |
| Camarilla | 1,889.7 | 1,892.8 | 1,895.9 | 1,899.0 | 1,902.1 | 1,905.2 | 1,908.4 |
| Woodie | 1,848.0 | 1,872.8 | 1,882.0 | 1,906.8 | 1,916.0 | 1,940.8 | 1,950.0 |
| Fibonacci | 1,875.3 | 1,888.3 | 1,896.4 | 1,909.3 | 1,922.3 | 1,930.4 | 1,943.3 |
| Pivot points | S3 | S2 | S1 | PP | R1 | R2 | R3 |
|---|---|---|---|---|---|---|---|
| Standard | 1,810.0 | 1,847.0 | 1,873.0 | 1,910.0 | 1,936.0 | 1,973.0 | 1,999.0 |
| Camarilla | 1,881.7 | 1,887.5 | 1,893.2 | 1,899.0 | 1,904.8 | 1,910.6 | 1,916.3 |
| Woodie | 1,804.5 | 1,844.3 | 1,867.5 | 1,907.3 | 1,930.5 | 1,970.3 | 1,993.5 |
| Fibonacci | 1,847.0 | 1,871.1 | 1,885.9 | 1,910.0 | 1,934.1 | 1,948.9 | 1,973.0 |
| Pivot points | S3 | S2 | S1 | PP | R1 | R2 | R3 |
|---|---|---|---|---|---|---|---|
| Standard | 1,631.3 | 1,745.7 | 1,877.3 | 1,991.7 | 2,123.3 | 2,237.7 | 2,369.3 |
| Camarilla | 1,941.4 | 1,963.9 | 1,986.5 | 2,009.0 | 2,031.6 | 2,054.1 | 2,076.7 |
| Woodie | 1,640.0 | 1,750.0 | 1,886.0 | 1,996.0 | 2,132.0 | 2,242.0 | 2,378.0 |
| Fibonacci | 1,745.7 | 1,839.6 | 1,897.7 | 1,991.7 | 2,085.6 | 2,143.7 | 2,237.7 |
Numerical data
The following is the status of technical indicators and moving averages registered at the time this technical analysis was created:
| RSI (14): | 41.50 | |
| MACD (12,26,9): | -15.4000 | |
| Directional Movement: | -11.6 | |
| AROON (14): | -57.2 | |
| DEMA (21): | 1,945.9 | |
| Parabolic SAR (0,02-0,02-0,2): | 2,030.1 | |
| Elder Ray (13): | -29.7 | |
| Super Trend (3,10): | 2,058.5 | |
| Zig ZAG (10): | 1,913.0 | |
| VORTEX (21): | 1.0000 | |
| Stochastique (14,3,5): | 11.90 | |
| TEMA (21): | 1,927.1 | |
| Williams %R (14): | -85.80 | |
| Chande Momentum Oscillator (20): | -155.5 | |
| Repulse (5,40,3): | -1.9000 | |
| ROCnROLL: | 2 | |
| TRIX (15,9): | 0.0000 | |
| Courbe Coppock: | 8.20 |
| MA7: | 1,913.6 | |
| MA20: | 1,983.2 | |
| MA50: | 1,955.8 | |
| MA100: | 2,000.5 | |
| MAexp7: | 1,927.2 | |
| MAexp20: | 1,957.8 | |
| MAexp50: | 1,968.8 | |
| MAexp100: | 1,989.4 | |
| Price / MA7: | -0.08% | |
| Price / MA20: | -3.59% | |
| Price / MA50: | -2.24% | |
| Price / MA100: | -4.42% | |
| Price / MAexp7: | -0.79% | |
| Price / MAexp20: | -2.34% | |
| Price / MAexp50: | -2.89% | |
| Price / MAexp100: | -3.89% |
News
The latest news and videos published on PERSIMMON ORD 10P at the time of the analysis were as follows:
 Persimmon
About author

Online


Add a comment
Comments
0 comments on the analysis PERSIMMON ORD 10P - Daily