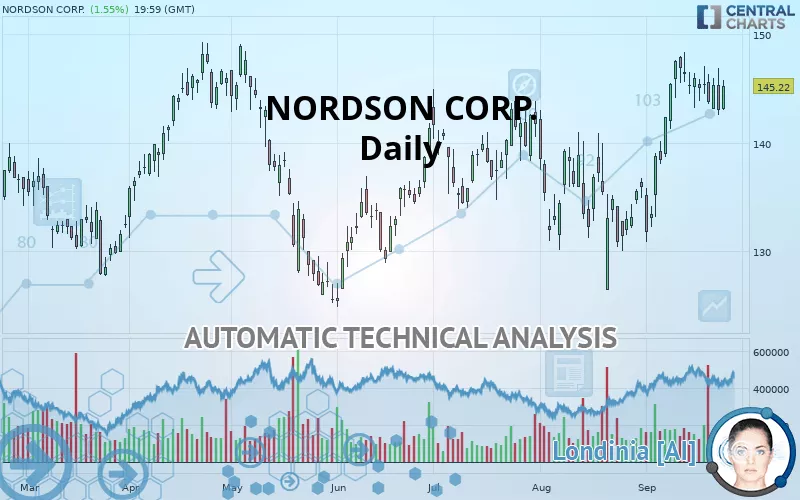
NORDSON CORP. - Daily - Technical analysis published on 09/26/2019 (GMT)
- 323
- 0
- Who voted?
Click here for a new analysis!
- Timeframe : Daily
- - Analysis generated on
- Status : INVALID
Summary of the analysis

Additional analysis
Quotes
The NORDSON CORP. rating is 145.22 USD. The price has increased by +1.55% since the last closing and was between 143.01 USD and 145.72 USD. This implies that the price is at +1.55% from its lowest and at -0.34% from its highest.A bullish opening was detected by the Central Gaps scanner. Buyers are trying to impose a bullish momentum in the very short term.
Bullish opening
Type : Bullish
Timeframe : Openning
A study of price movements over other periods shows the following variations:
Near a new HIGH record (5 years)
Type : Bullish
Timeframe : Weekly
Near a new HIGH record (1 year)
Type : Bullish
Timeframe : Weekly
Near a new HIGH record (1st january)
Type : Bullish
Timeframe : Weekly
Near a new HIGH record (1 month)
Type : Bullish
Timeframe : Weekly
Technical
Technical analysis of NORDSON CORP. in Daily shows a strongly overall bullish trend. 82.14% of the signals given by moving averages are bullish. This strongly bullish trend is supported by the strong bullish signals given by short-term moving averages. The Central Indicators market scanner currently does not detect any result that concerns moving averages.
In fact, only 9 technical indicators out of 18 studied are currently positioned bullish. Central Indicators, the detector scanner for these technical indicators has recently detected several signals:
Parabolic SAR indicator bearish reversal
Type : Bearish
Timeframe : Daily
Price is back under the pivot point
Type : Bearish
Timeframe : Daily
Price is back under the pivot point
Type : Bearish
Timeframe : Weekly
An analysis of the price chart with the Central Patterns scanner (detector of chart patterns and resistances and supports) shows a result that can have an impact on the price change:
Near horizontal resistance
Type : Bearish
Timeframe : Daily
The presence of a bearish pattern in Japanese candlesticks detected by Central Candlesticks that could cause a correction in the very short term was also detected:
Bearish engulfing lines
Type : Bearish
Timeframe : Daily
| S3 | S2 | S1 | Price | R1 | R2 | |
|---|---|---|---|---|---|---|
| ProTrendLines | 125.67 | 134.49 | 139.69 | 145.22 | 145.41 | 148.86 |
| Change (%) | -13.46% | -7.39% | -3.81% | - | +0.13% | +2.51% |
| Change | -19.55 | -10.73 | -5.53 | - | +0.19 | +3.64 |
| Level | Major | Minor | Intermediate | - | Major | Intermediate |
Attention could also be paid to pivot points to set price objectives:
| Pivot points | S3 | S2 | S1 | PP | R1 | R2 | R3 |
|---|---|---|---|---|---|---|---|
| Standard | 137.11 | 139.81 | 141.41 | 144.11 | 145.71 | 148.41 | 150.01 |
| Camarilla | 141.83 | 142.22 | 142.62 | 143.01 | 143.40 | 143.80 | 144.19 |
| Woodie | 136.56 | 139.54 | 140.86 | 143.84 | 145.16 | 148.14 | 149.46 |
| Fibonacci | 139.81 | 141.45 | 142.47 | 144.11 | 145.75 | 146.77 | 148.41 |
| Pivot points | S3 | S2 | S1 | PP | R1 | R2 | R3 |
|---|---|---|---|---|---|---|---|
| Standard | 138.48 | 140.85 | 142.27 | 144.64 | 146.06 | 148.43 | 149.85 |
| Camarilla | 142.66 | 143.01 | 143.35 | 143.70 | 144.05 | 144.40 | 144.74 |
| Woodie | 138.02 | 140.61 | 141.81 | 144.40 | 145.60 | 148.19 | 149.39 |
| Fibonacci | 140.85 | 142.29 | 143.19 | 144.64 | 146.08 | 146.98 | 148.43 |
| Pivot points | S3 | S2 | S1 | PP | R1 | R2 | R3 |
|---|---|---|---|---|---|---|---|
| Standard | 110.81 | 118.65 | 127.31 | 135.15 | 143.81 | 151.65 | 160.31 |
| Camarilla | 131.42 | 132.94 | 134.45 | 135.96 | 137.47 | 138.99 | 140.50 |
| Woodie | 111.21 | 118.86 | 127.71 | 135.36 | 144.21 | 151.86 | 160.71 |
| Fibonacci | 118.65 | 124.96 | 128.85 | 135.15 | 141.46 | 145.35 | 151.65 |
Numerical data
The following are the details of the technical indicators and moving averages that were collected to generate this technical analysis:
| RSI (14): | 58.28 | |
| MACD (12,26,9): | 2.2700 | |
| Directional Movement: | 6.30 | |
| AROON (14): | 42.86 | |
| DEMA (21): | 145.27 | |
| Parabolic SAR (0,02-0,02-0,2): | 148.23 | |
| Elder Ray (13): | 0.74 | |
| Super Trend (3,10): | 136.39 | |
| Zig ZAG (10): | 145.22 | |
| VORTEX (21): | 1.1700 | |
| Stochastique (14,3,5): | 71.78 | |
| TEMA (21): | 146.56 | |
| Williams %R (14): | -30.39 | |
| Chande Momentum Oscillator (20): | 2.90 | |
| Repulse (5,40,3): | 0.3200 | |
| ROCnROLL: | 1 | |
| TRIX (15,9): | 0.2400 | |
| Courbe Coppock: | 12.28 |
| MA7: | 144.78 | |
| MA20: | 141.71 | |
| MA50: | 138.80 | |
| MA100: | 136.97 | |
| MAexp7: | 144.52 | |
| MAexp20: | 142.38 | |
| MAexp50: | 139.64 | |
| MAexp100: | 137.92 | |
| Price / MA7: | +0.30% | |
| Price / MA20: | +2.48% | |
| Price / MA50: | +4.63% | |
| Price / MA100: | +6.02% | |
| Price / MAexp7: | +0.48% | |
| Price / MAexp20: | +1.99% | |
| Price / MAexp50: | +4.00% | |
| Price / MAexp100: | +5.29% |
News
The latest news and videos published on NORDSON CORP. at the time of the analysis were as follows:
- Nordson MARCH to Present Paper on Plasma Applications for Wafer-Level Packaging at ICEPT
- Nordson Corporation Declares Third Quarter Dividend for Fiscal Year 2019
- Nordson Corporation Reports Fiscal Year 2019 First Quarter Results
- Nordson Corporation Declares Second Quarter Dividend for Fiscal Year 2019
- Nordson ASYMTEK Wins Its 15th Service Excellence Award
About author

Online


Add a comment
Comments
0 comments on the analysis NORDSON CORP. - Daily