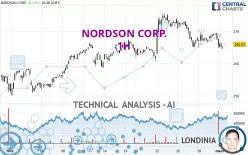
NORDSON CORP. - 1H - Technical analysis published on 03/01/2024 (GMT)
- 176
- 0
Click here for a new analysis!
- Timeframe : 1H
- - Analysis generated on
- Status : TARGET REACHED

Summary of the analysis

Additional analysis
Quotes
The NORDSON CORP. price is 265.39 USD. The price is lower by -0.10% since the last closing with the lowest point at 264.55 USD and the highest point at 266.57 USD. The deviation from the price is +0.32% for the low point and -0.44% for the high point.The Central Gaps scanner detects a bearish opening marking the presence of sellers ahead of buyers at the opening but not sufficiently marked to allow the price to register a quotation gap.
Bearish opening
Type : Bearish
Timeframe : Openning
Here is a more detailed summary of the historical variations registered by NORDSON CORP.:
Near a new HIGH record (5 years)
Type : Bullish
Timeframe : Weekly
Near a new HIGH record (1 year)
Type : Bullish
Timeframe : Weekly
Near a new HIGH record (1st january)
Type : Bullish
Timeframe : Weekly
Near a new HIGH record (1 month)
Type : Bullish
Timeframe : Weekly
Technical
Technical analysis of NORDSON CORP. in 1H shows an overall slightly bearish trend. Only 60.71% of the signals given by moving averages are bearish. This slightly bearish trend is reinforced by the strong signals currently being given by short-term moving averages. The Central Indicators scanner detects a bearish signal on moving averages that could impact this trend:
Bearish trend reversal : adaptative moving average 100
Type : Bearish
Timeframe : 1 hour
In fact, 13 technical indicators on 18 studied are currently positioned bearish. But beware of excesses. The Central Indicators scanner currently detects this:
CCI indicator is oversold : under -100
Type : Neutral
Timeframe : 1 hour
Williams %R indicator is oversold : under -80
Type : Neutral
Timeframe : 1 hour
Price is back under the pivot point
Type : Bearish
Timeframe : Weekly
The Central Patterns scanner, which studies chart patterns, resistances and supports, has identified these signals:
Near horizontal support
Type : Bullish
Timeframe : 1 hour
Support of channel is broken
Type : Bearish
Timeframe : 1 hour
The Central Candlesticks scanner which studies Japanese candlesticks did not detect anything.
| S3 | S2 | S1 | Price | R1 | R2 | R3 | |
|---|---|---|---|---|---|---|---|
| ProTrendLines | 257.83 | 260.74 | 263.67 | 265.39 | 265.81 | 269.63 | 275.67 |
| Change (%) | -2.85% | -1.75% | -0.65% | - | +0.16% | +1.60% | +3.87% |
| Change | -7.56 | -4.65 | -1.72 | - | +0.42 | +4.24 | +10.28 |
| Level | Intermediate | Minor | Major | - | Intermediate | Minor | Intermediate |
Attention could also be paid to pivot points to set price objectives:
| Pivot points | S3 | S2 | S1 | PP | R1 | R2 | R3 |
|---|---|---|---|---|---|---|---|
| Standard | 259.05 | 261.92 | 263.78 | 266.65 | 268.51 | 271.38 | 273.24 |
| Camarilla | 264.35 | 264.78 | 265.22 | 265.65 | 266.08 | 266.52 | 266.95 |
| Woodie | 258.56 | 261.67 | 263.29 | 266.40 | 268.02 | 271.13 | 272.75 |
| Fibonacci | 261.92 | 263.72 | 264.84 | 266.65 | 268.45 | 269.57 | 271.38 |
| Pivot points | S3 | S2 | S1 | PP | R1 | R2 | R3 |
|---|---|---|---|---|---|---|---|
| Standard | 249.48 | 255.11 | 264.41 | 270.04 | 279.34 | 284.97 | 294.27 |
| Camarilla | 269.60 | 270.97 | 272.34 | 273.71 | 275.08 | 276.45 | 277.82 |
| Woodie | 251.32 | 256.03 | 266.25 | 270.96 | 281.18 | 285.89 | 296.11 |
| Fibonacci | 255.11 | 260.81 | 264.34 | 270.04 | 275.74 | 279.27 | 284.97 |
| Pivot points | S3 | S2 | S1 | PP | R1 | R2 | R3 |
|---|---|---|---|---|---|---|---|
| Standard | 225.42 | 237.48 | 251.56 | 263.62 | 277.70 | 289.76 | 303.84 |
| Camarilla | 258.46 | 260.86 | 263.25 | 265.65 | 268.05 | 270.44 | 272.84 |
| Woodie | 226.44 | 237.99 | 252.58 | 264.13 | 278.72 | 290.27 | 304.86 |
| Fibonacci | 237.48 | 247.46 | 253.63 | 263.62 | 273.60 | 279.77 | 289.76 |
Numerical data
The following are the details of the technical indicators and moving averages that were collected to generate this technical analysis:
| RSI (14): | 36.81 | |
| MACD (12,26,9): | -0.8500 | |
| Directional Movement: | -18.54 | |
| AROON (14): | -21.43 | |
| DEMA (21): | 266.44 | |
| Parabolic SAR (0,02-0,02-0,2): | 269.24 | |
| Elder Ray (13): | -1.95 | |
| Super Trend (3,10): | 269.71 | |
| Zig ZAG (10): | 264.55 | |
| VORTEX (21): | 0.9000 | |
| Stochastique (14,3,5): | 14.24 | |
| TEMA (21): | 265.61 | |
| Williams %R (14): | -100.00 | |
| Chande Momentum Oscillator (20): | -3.05 | |
| Repulse (5,40,3): | -0.8500 | |
| ROCnROLL: | 2 | |
| TRIX (15,9): | -0.0400 | |
| Courbe Coppock: | 0.61 |
| MA7: | 269.05 | |
| MA20: | 263.27 | |
| MA50: | 257.85 | |
| MA100: | 242.43 | |
| MAexp7: | 266.27 | |
| MAexp20: | 267.49 | |
| MAexp50: | 267.72 | |
| MAexp100: | 265.63 | |
| Price / MA7: | -1.36% | |
| Price / MA20: | +0.81% | |
| Price / MA50: | +2.92% | |
| Price / MA100: | +9.47% | |
| Price / MAexp7: | -0.33% | |
| Price / MAexp20: | -0.79% | |
| Price / MAexp50: | -0.87% | |
| Price / MAexp100: | -0.09% |
News
Don't forget to follow the news on NORDSON CORP.. At the time of publication of this analysis, the latest news was as follows:
- Nordson Corporation Reports Third Quarter Fiscal 2023 Results and Narrows Annual Guidance
- Nordson’s Semiconductor Advanced Packaging Solutions Will Be Demonstrated at SEMICON Taiwan 2023
- Nordson Corporation Board of Directors Increases Dividend 5 Percent, Marking 60 Consecutive Years of Annual Dividend Increases
- Nordson Corporation Announces Earnings Release and Webcast for Third Quarter Fiscal Year 2023
- Nordson Corporation Announces Agreement to Acquire ARAG, Expanding its Core Dispense Capabilities into the Attractive Precision Agriculture Market
About author
Online


Add a comment
Comments
0 comments on the analysis NORDSON CORP. - 1H