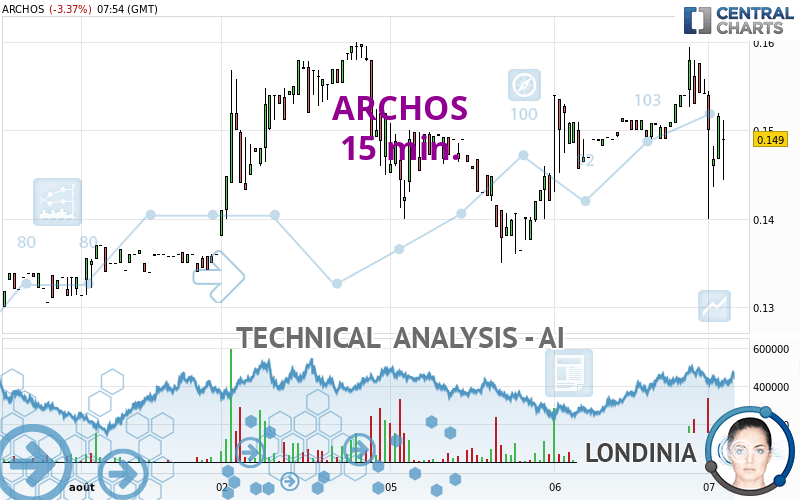
ARCHOS - 15 min. - Technical analysis published on 08/07/2024 (GMT)
- 79
- 0
Click here for a new analysis!
- Timeframe : 15 min.
- - Analysis generated on
- Status : INVALID

Summary of the analysis

Additional analysis
Quotes
ARCHOS rating 0.1490 EUR. The price registered a decrease of -3.37% on the session and was traded between 0.1400 EUR and 0.1544 EUR over the period. The price is currently at +6.43% from its lowest and -3.50% from its highest.A bearish opening was detected by the Central Gaps scanner. Sellers are trying to impose a bearish trend in the very short term.
Bearish opening
Type : Bearish
Timeframe : Openning
Here is a more detailed summary of the historical variations registered by ARCHOS:
Technical
Technical analysis of ARCHOS in 15 min. shows an overall bullish trend. The signals given by moving averages are 64.29% bullish. This bullish trend could slow down given the neutral signals currently being given by short-term moving averages. The Central Indicators market scanner is currently detecting several bearish signals that could impact this trend:
Bearish price crossover with Moving Average 50
Type : Bearish
Timeframe : 15 minutes
Bearish price crossover with Moving Average 100
Type : Bearish
Timeframe : 15 minutes
Bearish price crossover with adaptative moving average 50
Type : Bearish
Timeframe : 15 minutes
An assessment of technical indicators shows a bearish signal.
But beware of excesses. The Central Indicators scanner currently detects this:
CCI indicator is oversold : under -100
Type : Neutral
Timeframe : 15 minutes
RSI indicator is back under 50
Type : Bearish
Timeframe : 15 minutes
Ichimoku : price is under the cloud
Type : Bearish
Timeframe : 15 minutes
MACD indicator is back under 0
Type : Bearish
Timeframe : 15 minutes
Momentum indicator is back under 0
Type : Bearish
Timeframe : 15 minutes
Williams %R indicator is back under -50
Type : Bearish
Timeframe : 15 minutes
Williams %R indicator is back over -50
Type : Bullish
Timeframe : 15 minutes
Central Patterns, the market scanner focusing on chart patterns, resistances and supports found this result:
Support of channel is broken
Type : Bearish
Timeframe : 15 minutes
The presence of these Japanese chandelier patterns detected by Central Candlesticks that could impact the current short-term trend were also noted:
Black line without upper shadow
Type : Bearish
Timeframe : 15 minutes
Doji
Type : Neutral
Timeframe : 15 minutes
Long black line
Type : Bearish
Timeframe : 15 minutes
| S3 | S2 | S1 | Price | R1 | R2 | R3 | |
|---|---|---|---|---|---|---|---|
| ProTrendLines | 0.0878 | 0.1059 | 0.1348 | 0.1490 | 0.1544 | 0.1688 | 0.4425 |
| Change (%) | -41.07% | -28.93% | -9.53% | - | +3.62% | +13.29% | +196.98% |
| Change | -0.0612 | -0.0431 | -0.0142 | - | +0.0054 | +0.0198 | +0.2935 |
| Level | Minor | Major | Intermediate | - | Intermediate | Minor | Minor |
Attention could also be paid to pivot points to set price objectives:
| Pivot points | S3 | S2 | S1 | PP | R1 | R2 | R3 |
|---|---|---|---|---|---|---|---|
| Standard | 0.1286 | 0.1358 | 0.1450 | 0.1522 | 0.1614 | 0.1686 | 0.1778 |
| Camarilla | 0.1497 | 0.1512 | 0.1527 | 0.1542 | 0.1557 | 0.1572 | 0.1587 |
| Woodie | 0.1296 | 0.1363 | 0.1460 | 0.1527 | 0.1624 | 0.1691 | 0.1788 |
| Fibonacci | 0.1358 | 0.1421 | 0.1459 | 0.1522 | 0.1585 | 0.1623 | 0.1686 |
| Pivot points | S3 | S2 | S1 | PP | R1 | R2 | R3 |
|---|---|---|---|---|---|---|---|
| Standard | 0.0763 | 0.0947 | 0.1233 | 0.1417 | 0.1703 | 0.1887 | 0.2173 |
| Camarilla | 0.1391 | 0.1434 | 0.1477 | 0.1520 | 0.1563 | 0.1606 | 0.1649 |
| Woodie | 0.0815 | 0.0973 | 0.1285 | 0.1443 | 0.1755 | 0.1913 | 0.2225 |
| Fibonacci | 0.0947 | 0.1126 | 0.1237 | 0.1417 | 0.1596 | 0.1707 | 0.1887 |
| Pivot points | S3 | S2 | S1 | PP | R1 | R2 | R3 |
|---|---|---|---|---|---|---|---|
| Standard | -0.0228 | 0.0226 | 0.0780 | 0.1234 | 0.1788 | 0.2242 | 0.2796 |
| Camarilla | 0.1057 | 0.1149 | 0.1242 | 0.1334 | 0.1426 | 0.1519 | 0.1611 |
| Woodie | -0.0178 | 0.0251 | 0.0830 | 0.1259 | 0.1838 | 0.2267 | 0.2846 |
| Fibonacci | 0.0226 | 0.0611 | 0.0849 | 0.1234 | 0.1619 | 0.1857 | 0.2242 |
Numerical data
The following are the details of the technical indicators and moving averages that were collected to generate this technical analysis:
| RSI (14): | 42.15 | |
| MACD (12,26,9): | 0.0000 | |
| Directional Movement: | -11.1411 | |
| AROON (14): | -28.5714 | |
| DEMA (21): | 0.1510 | |
| Parabolic SAR (0,02-0,02-0,2): | 0.1583 | |
| Elder Ray (13): | -0.0054 | |
| Super Trend (3,10): | 0.1585 | |
| Zig ZAG (10): | 0.1450 | |
| VORTEX (21): | 0.7726 | |
| Stochastique (14,3,5): | 39.86 | |
| TEMA (21): | 0.1510 | |
| Williams %R (14): | -53.61 | |
| Chande Momentum Oscillator (20): | -0.0014 | |
| Repulse (5,40,3): | 2.9070 | |
| ROCnROLL: | 2 | |
| TRIX (15,9): | 0.1130 | |
| Courbe Coppock: | 0.33 |
| MA7: | 0.1435 | |
| MA20: | 0.1267 | |
| MA50: | 0.1009 | |
| MA100: | 0.0895 | |
| MAexp7: | 0.1503 | |
| MAexp20: | 0.1511 | |
| MAexp50: | 0.1495 | |
| MAexp100: | 0.1472 | |
| Price / MA7: | +3.83% | |
| Price / MA20: | +17.60% | |
| Price / MA50: | +47.67% | |
| Price / MA100: | +66.48% | |
| Price / MAexp7: | -0.86% | |
| Price / MAexp20: | -1.39% | |
| Price / MAexp50: | -0.33% | |
| Price / MAexp100: | +1.22% |
News
The latest news and videos published on ARCHOS at the time of the analysis were as follows:
- Ossia and ARCHOS Secure CES Innovation Award for the First Ever Real Wireless Power™ Security Cameras
-
 The Latest "Beehind the Buzz" Show: Featuring Verano Holdings LLC CEO George Archos
-
Archos
-
Archos
-
New Archos Tablet Has Integral Cover/Keyboard
About author

Online


Add a comment
Comments
0 comments on the analysis ARCHOS - 15 min.