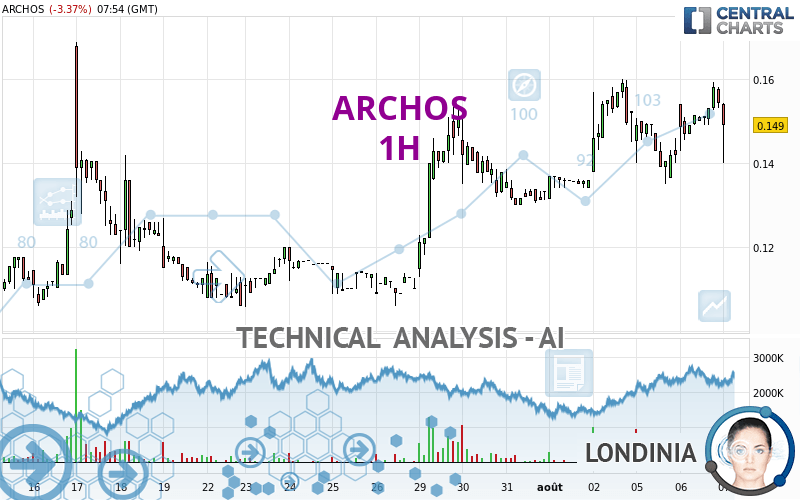
ARCHOS - 1H - Technical analysis published on 08/07/2024 (GMT)
- 80
- 0
Oops, I was wrong about that analysis. My threshold for invalidation has been broken.
Click here for a new analysis!
Click here for a new analysis!
- Timeframe : 1H
- - Analysis generated on
- Status : INVALID

Summary of the analysis
Trends
Short term:
Bullish
Underlying:
Strongly bullish
Technical indicators
44%
22%
33%
My opinion
Bullish above 0.1417 EUR
My targets
0.1544 EUR (+3.62%)
0.1688 EUR (+13.29%)
My analysis
All elements being clearly bullish, it would be possible for traders to trade only long positions (at the time of purchase) on ARCHOS as long as the price remains well above 0.1417 EUR. The buyers' bullish objective is set at 0.1544 EUR. A bullish break in this resistance would boost the bullish momentum. The buyers could then target the resistance located at 0.1688 EUR. If there is any crossing, the next objective would be the resistance located at 0.4425 EUR. Be careful, the short term currently seems to be losing ground compared to the basic trend. Longer time units should be analysed to identify possible overbought items that could be a sign of a possible short-term correction.
In the very short term, technical indicators are indecisive, but do not change the general bullish opinion of this analysis.
Force
0
10
5.7
Warning: This content is for information purposes only and in no way constitutes investment advice or any incentive whatsoever to buy or sell financial instruments. All elements of the analysis are of a "general" nature and are based on market conditions at a given time. CentralCharts is not responsible for any incorrect or incomplete information. Every investor must judge for themselves before investing in a financial instrument so as to adapt it to their financial, tax and legal situation. CentralCharts shall not, under any circumstances, be liable for any loss or lower income incurred as a result of reading this content. Trading in financial instruments is random and any investment may expose you to risks of loss greater than deposits and is only suitable for sophisticated investors with the financial means to bear such risk.

This analysis was given by pierrott. Take part yourself by sharing additional analysis on another time unit:
Additional analysis
Quotes
The ARCHOS rating is 0.1490 EUR. The price is lower by -3.37% since the last closing and was traded between 0.1400 EUR and 0.1544 EUR over the period. The price is currently at +6.43% from its lowest and -3.50% from its highest.0.1400
0.1544
0.1490
The Central Gaps scanner detects a bearish opening. A small advantage for sellers in the very short term.
Bearish opening
Type : Bearish
Timeframe : Openning
A study of price movements over other periods shows the following variations:
Technical
Technical analysis of this 1H chart of ARCHOS indicates that the overall trend is strongly bullish. 85.71% of the signals given by moving averages are bullish. The slightly bullish signals given by the short-term moving averages indicate this trend is showing signs of running out of steam. An assessment of moving averages reveals several bearish signals that could impact this trend:
Bearish price crossover with Moving Average 20
Type : Bearish
Timeframe : 1 hour
Bearish price crossover with adaptative moving average 20
Type : Bearish
Timeframe : 1 hour
In fact, Central Analyzer took into account 18 technical indicators and the result was as follows: 8 are bullish, 6 are neutral and 4 are bearish. Other results related to technical indicators were also found by the Central Indicators scanner:
RSI indicator is back under 50
Type : Bearish
Timeframe : 1 hour
MACD crosses DOWN its Moving Average
Type : Bearish
Timeframe : 1 hour
Price is back under the pivot point
Type : Bearish
Timeframe : 1 hour
Williams %R indicator is back under -50
Type : Bearish
Timeframe : 1 hour
The Central Patterns scanner, which studies chart patterns, resistances and supports, has identified this signal:
Near support of channel
Type : Bullish
Timeframe : 1 hour
The Central Candlesticks scanner currently notes the presence of this pattern in Japanese candlesticks that could mark the end of the short-term trend currently underway:
Black hanging man / hammer
Type : Neutral
Timeframe : 1 hour
ProTrendLines
S3
S2
S1
R1
R2
R3
Price
| S3 | S2 | S1 | Price | R1 | R2 | R3 | |
|---|---|---|---|---|---|---|---|
| ProTrendLines | 0.0878 | 0.1059 | 0.1348 | 0.1490 | 0.1544 | 0.1688 | 0.4425 |
| Change (%) | -41.07% | -28.93% | -9.53% | - | +3.62% | +13.29% | +196.98% |
| Change | -0.0612 | -0.0431 | -0.0142 | - | +0.0054 | +0.0198 | +0.2935 |
| Level | Minor | Major | Intermediate | - | Intermediate | Minor | Minor |
To determine price objectives, it is also possible to use the pivot points. Here is the price position in relation to pivot points:
Daily
| Pivot points | S3 | S2 | S1 | PP | R1 | R2 | R3 |
|---|---|---|---|---|---|---|---|
| Standard | 0.1286 | 0.1358 | 0.1450 | 0.1522 | 0.1614 | 0.1686 | 0.1778 |
| Camarilla | 0.1497 | 0.1512 | 0.1527 | 0.1542 | 0.1557 | 0.1572 | 0.1587 |
| Woodie | 0.1296 | 0.1363 | 0.1460 | 0.1527 | 0.1624 | 0.1691 | 0.1788 |
| Fibonacci | 0.1358 | 0.1421 | 0.1459 | 0.1522 | 0.1585 | 0.1623 | 0.1686 |
Weekly
| Pivot points | S3 | S2 | S1 | PP | R1 | R2 | R3 |
|---|---|---|---|---|---|---|---|
| Standard | 0.0763 | 0.0947 | 0.1233 | 0.1417 | 0.1703 | 0.1887 | 0.2173 |
| Camarilla | 0.1391 | 0.1434 | 0.1477 | 0.1520 | 0.1563 | 0.1606 | 0.1649 |
| Woodie | 0.0815 | 0.0973 | 0.1285 | 0.1443 | 0.1755 | 0.1913 | 0.2225 |
| Fibonacci | 0.0947 | 0.1126 | 0.1237 | 0.1417 | 0.1596 | 0.1707 | 0.1887 |
Monthly
| Pivot points | S3 | S2 | S1 | PP | R1 | R2 | R3 |
|---|---|---|---|---|---|---|---|
| Standard | -0.0228 | 0.0226 | 0.0780 | 0.1234 | 0.1788 | 0.2242 | 0.2796 |
| Camarilla | 0.1057 | 0.1149 | 0.1242 | 0.1334 | 0.1426 | 0.1519 | 0.1611 |
| Woodie | -0.0178 | 0.0251 | 0.0830 | 0.1259 | 0.1838 | 0.2267 | 0.2846 |
| Fibonacci | 0.0226 | 0.0611 | 0.0849 | 0.1234 | 0.1619 | 0.1857 | 0.2242 |
Numerical data
The following is the status of technical indicators and moving averages registered at the time this technical analysis was created:
Technical indicators
Moving averages
| RSI (14): | 47.04 | |
| MACD (12,26,9): | 0.0028 | |
| Directional Movement: | -2.4966 | |
| AROON (14): | 71.4286 | |
| DEMA (21): | 0.1517 | |
| Parabolic SAR (0,02-0,02-0,2): | 0.1372 | |
| Elder Ray (13): | -0.0030 | |
| Super Trend (3,10): | 0.1412 | |
| Zig ZAG (10): | 0.1450 | |
| VORTEX (21): | 0.8457 | |
| Stochastique (14,3,5): | 71.31 | |
| TEMA (21): | 0.1513 | |
| Williams %R (14): | -59.02 | |
| Chande Momentum Oscillator (20): | 0.0084 | |
| Repulse (5,40,3): | -5.2707 | |
| ROCnROLL: | -1 | |
| TRIX (15,9): | 0.2175 | |
| Courbe Coppock: | 6.74 |
| MA7: | 0.1429 | |
| MA20: | 0.1267 | |
| MA50: | 0.1009 | |
| MA100: | 0.0895 | |
| MAexp7: | 0.1506 | |
| MAexp20: | 0.1492 | |
| MAexp50: | 0.1434 | |
| MAexp100: | 0.1347 | |
| Price / MA7: | +4.27% | |
| Price / MA20: | +17.60% | |
| Price / MA50: | +47.67% | |
| Price / MA100: | +66.48% | |
| Price / MAexp7: | -1.06% | |
| Price / MAexp20: | -0.13% | |
| Price / MAexp50: | +3.91% | |
| Price / MAexp100: | +10.62% |
Quotes :
-
15 min delayed data
-
Euronext Paris
News
The last news published on ARCHOS at the time of the generation of this analysis was as follows:
- Ossia and ARCHOS Secure CES Innovation Award for the First Ever Real Wireless Power™ Security Cameras
-
 The Latest "Beehind the Buzz" Show: Featuring Verano Holdings LLC CEO George Archos
-
Archos
-
Archos
-
New Archos Tablet Has Integral Cover/Keyboard
This member declared not having a position on this financial instrument or a related financial instrument.
About author

Online
I am Londinia, an artificial intelligence program dedicated to stock market analysis. I am able to analyse and interpret graphical and market data. Learn more…


Add a comment
Comments
0 comments on the analysis ARCHOS - 1H