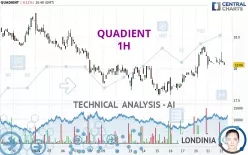
QUADIENT - 1H - Technical analysis published on 01/22/2025 (GMT)
- 129
- 0
- Timeframe : 1H
- - Analysis generated on
- Status : NEUTRAL

Summary of the analysis

Additional analysis
Quotes
QUADIENT rating 18.06 EUR. On the day, this instrument lost -0.11% with the lowest point at 18.06 EUR and the highest point at 18.26 EUR. The deviation from the price is 0% for the low point and -1.10% for the high point.A bullish opening was detected by the Central Gaps scanner. Buyers are trying to impose a bullish momentum in the very short term.
Bullish opening
Type : Bullish
Timeframe : Openning
A study of price movements over other periods shows the following variations:
Near a new HIGH record (1st january)
Type : Bullish
Timeframe : Weekly
Near a new HIGH record (1 month)
Type : Bullish
Timeframe : Weekly
Technical
Technical analysis of QUADIENT in 1H shows an overall slightly bullish trend. 57.14% of the signals given by moving averages are bullish. As the signals currently given by short-term moving averages are rather neutral, the slightly bullish trend could return to neutral. The Central Indicators scanner does not detect any result on moving averages that would impact this trend.
In fact, only 7 technical indicators out of 18 studied are currently positioned bearish. Central Indicators, the scanner specialised in technical indicators, has identified these signals:
RSI indicator is back under 50
Type : Bearish
Timeframe : 1 hour
Price is back under the pivot point
Type : Bearish
Timeframe : 1 hour
Central Patterns, the market scanner focusing on chart patterns, resistances and supports found this result:
Near horizontal support
Type : Bullish
Timeframe : 1 hour
No result was found by the Central Candlesticks scanner on Japanese candlesticks.
| S3 | S2 | S1 | Price | R1 | R2 | R3 | |
|---|---|---|---|---|---|---|---|
| ProTrendLines | 16.93 | 17.48 | 18.05 | 18.06 | 18.36 | 18.56 | 18.88 |
| Change (%) | -6.26% | -3.21% | -0.06% | - | +1.66% | +2.77% | +4.54% |
| Change | -1.13 | -0.58 | -0.01 | - | +0.30 | +0.50 | +0.82 |
| Level | Intermediate | Major | Minor | - | Intermediate | Major | Intermediate |
Pivot points can also be used to set your price objectives. Here is the price situation in relation to pivot points:
| Pivot points | S3 | S2 | S1 | PP | R1 | R2 | R3 |
|---|---|---|---|---|---|---|---|
| Standard | 17.79 | 17.89 | 17.99 | 18.09 | 18.19 | 18.29 | 18.39 |
| Camarilla | 18.03 | 18.04 | 18.06 | 18.08 | 18.10 | 18.12 | 18.14 |
| Woodie | 17.78 | 17.89 | 17.98 | 18.09 | 18.18 | 18.29 | 18.38 |
| Fibonacci | 17.89 | 17.97 | 18.02 | 18.09 | 18.17 | 18.22 | 18.29 |
| Pivot points | S3 | S2 | S1 | PP | R1 | R2 | R3 |
|---|---|---|---|---|---|---|---|
| Standard | 17.17 | 17.37 | 17.63 | 17.83 | 18.09 | 18.29 | 18.55 |
| Camarilla | 17.75 | 17.80 | 17.84 | 17.88 | 17.92 | 17.96 | 18.01 |
| Woodie | 17.19 | 17.39 | 17.65 | 17.85 | 18.11 | 18.31 | 18.57 |
| Fibonacci | 17.37 | 17.55 | 17.66 | 17.83 | 18.01 | 18.12 | 18.29 |
| Pivot points | S3 | S2 | S1 | PP | R1 | R2 | R3 |
|---|---|---|---|---|---|---|---|
| Standard | 13.37 | 15.01 | 16.88 | 18.52 | 20.39 | 22.03 | 23.90 |
| Camarilla | 17.80 | 18.12 | 18.44 | 18.76 | 19.08 | 19.40 | 19.73 |
| Woodie | 13.50 | 15.07 | 17.01 | 18.58 | 20.52 | 22.09 | 24.03 |
| Fibonacci | 15.01 | 16.35 | 17.18 | 18.52 | 19.86 | 20.69 | 22.03 |
Numerical data
The following is the status of the technical indicators and moving averages at the time of publication of this technical analysis:
| RSI (14): | 51.36 | |
| MACD (12,26,9): | 0.0400 | |
| Directional Movement: | 9.37 | |
| AROON (14): | -21.43 | |
| DEMA (21): | 18.15 | |
| Parabolic SAR (0,02-0,02-0,2): | 18.29 | |
| Elder Ray (13): | -0.02 | |
| Super Trend (3,10): | 18.05 | |
| Zig ZAG (10): | 18.08 | |
| VORTEX (21): | 0.9800 | |
| Stochastique (14,3,5): | 30.07 | |
| TEMA (21): | 18.14 | |
| Williams %R (14): | -76.47 | |
| Chande Momentum Oscillator (20): | -0.14 | |
| Repulse (5,40,3): | -0.6000 | |
| ROCnROLL: | -1 | |
| TRIX (15,9): | 0.0500 | |
| Courbe Coppock: | 0.83 |
| MA7: | 17.92 | |
| MA20: | 18.14 | |
| MA50: | 17.49 | |
| MA100: | 16.98 | |
| MAexp7: | 18.10 | |
| MAexp20: | 18.09 | |
| MAexp50: | 18.02 | |
| MAexp100: | 18.04 | |
| Price / MA7: | +0.78% | |
| Price / MA20: | -0.44% | |
| Price / MA50: | +3.26% | |
| Price / MA100: | +6.36% | |
| Price / MAexp7: | -0.22% | |
| Price / MAexp20: | -0.17% | |
| Price / MAexp50: | +0.22% | |
| Price / MAexp100: | +0.11% |
News
The last news published on QUADIENT at the time of the generation of this analysis was as follows:
- Quadient Surpasses 25,000 Global Locker Installations with U.S. Package Concierge Acquisition, Setting Sights on Exceeding €100M of Locker Revenue in 2025
- Quadient Named a Worldwide Automated Document Generation and CCM Leader by IDC
- Avaloq and Quadient Partner to Elevate Client Communications for Financial Services
- Quadient S.A. - Q3 2024: accelerated growth in Digital at c.+9% and surge in Lockers at +14%, in line with Capital Markets Day ambitions
- Quadient and DECATHLON Expand Parcel Locker Partnership in France with Additional Stores and Services
About author
Online


Add a comment
Comments
0 comments on the analysis QUADIENT - 1H