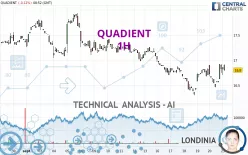
QUADIENT - 1H - Technical analysis published on 09/23/2024 (GMT)
- 169
- 0
Click here for a new analysis!
- Timeframe : 1H
- - Analysis generated on
- Status : TARGET REACHED

Summary of the analysis

Additional analysis
Quotes
The QUADIENT rating is 16.80 EUR. On the day, this instrument lost -0.12% and was between 16.70 EUR and 16.92 EUR. This implies that the price is at +0.60% from its lowest and at -0.71% from its highest.Here is a more detailed summary of the historical variations registered by QUADIENT:
Near a new LOW record (1 year)
Type : Bearish
Timeframe : Weekly
Near a new LOW record (1st january)
Type : Bearish
Timeframe : Weekly
Near a new LOW record (1 month)
Type : Bearish
Timeframe : Weekly
Technical
Technical analysis of this 1H chart of QUADIENT indicates that the overall trend is slightly bearish. 57.14% of the signals given by moving averages are bearish. Caution: the strong bullish signals currently being given by short-term moving averages could quickly lead to a reversal of the trend. An assessment of moving averages reveals a bearish signal that could impact this trend:
Bearish price crossover with adaptative moving average 50
Type : Bearish
Timeframe : 1 hour
An assessment of technical indicators shows a moderate bullish signal.
Central Indicators, the detector scanner for these technical indicators recently detected a signal:
Ichimoku : price is under the cloud
Type : Bearish
Timeframe : 1 hour
An analysis of the price chart with the Central Patterns scanner (detector of chart patterns and resistances and supports) shows several results that can have an impact on the price change:
Near horizontal resistance
Type : Bearish
Timeframe : 1 hour
Resistance of channel is broken
Type : Bullish
Timeframe : 1 hour
The presence of a bearish pattern in Japanese candlesticks detected by Central Candlesticks that could cause a correction in the very short term was also detected:
Bearish engulfing lines
Type : Bearish
Timeframe : 1 hour
| S3 | S2 | S1 | Price | R1 | R2 | R3 | |
|---|---|---|---|---|---|---|---|
| ProTrendLines | 16.30 | 16.46 | 16.72 | 16.80 | 16.89 | 17.24 | 17.48 |
| Change (%) | -2.98% | -2.02% | -0.48% | - | +0.54% | +2.62% | +4.05% |
| Change | -0.50 | -0.34 | -0.08 | - | +0.09 | +0.44 | +0.68 |
| Level | Major | Minor | Major | - | Minor | Intermediate | Major |
To determine price objectives, it is also possible to use the pivot points. Here is the price position in relation to pivot points:
| Pivot points | S3 | S2 | S1 | PP | R1 | R2 | R3 |
|---|---|---|---|---|---|---|---|
| Standard | 16.09 | 16.27 | 16.55 | 16.73 | 17.01 | 17.19 | 17.47 |
| Camarilla | 16.69 | 16.74 | 16.78 | 16.82 | 16.86 | 16.90 | 16.95 |
| Woodie | 16.13 | 16.30 | 16.59 | 16.76 | 17.05 | 17.22 | 17.51 |
| Fibonacci | 16.27 | 16.45 | 16.56 | 16.73 | 16.91 | 17.02 | 17.19 |
| Pivot points | S3 | S2 | S1 | PP | R1 | R2 | R3 |
|---|---|---|---|---|---|---|---|
| Standard | 15.61 | 15.95 | 16.39 | 16.73 | 17.17 | 17.51 | 17.95 |
| Camarilla | 16.61 | 16.68 | 16.75 | 16.82 | 16.89 | 16.96 | 17.04 |
| Woodie | 15.65 | 15.98 | 16.43 | 16.76 | 17.21 | 17.54 | 17.99 |
| Fibonacci | 15.95 | 16.25 | 16.44 | 16.73 | 17.03 | 17.22 | 17.51 |
| Pivot points | S3 | S2 | S1 | PP | R1 | R2 | R3 |
|---|---|---|---|---|---|---|---|
| Standard | 15.18 | 15.76 | 16.57 | 17.15 | 17.96 | 18.54 | 19.35 |
| Camarilla | 17.00 | 17.13 | 17.25 | 17.38 | 17.51 | 17.64 | 17.76 |
| Woodie | 15.30 | 15.82 | 16.69 | 17.21 | 18.08 | 18.60 | 19.47 |
| Fibonacci | 15.76 | 16.29 | 16.62 | 17.15 | 17.68 | 18.01 | 18.54 |
Numerical data
The following are the details of the technical indicators and moving averages that were collected to generate this technical analysis:
| RSI (14): | 54.19 | |
| MACD (12,26,9): | 0.0200 | |
| Directional Movement: | 14.67 | |
| AROON (14): | 21.43 | |
| DEMA (21): | 16.72 | |
| Parabolic SAR (0,02-0,02-0,2): | 16.49 | |
| Elder Ray (13): | 0.12 | |
| Super Trend (3,10): | 16.48 | |
| Zig ZAG (10): | 16.80 | |
| VORTEX (21): | 1.0200 | |
| Stochastique (14,3,5): | 79.71 | |
| TEMA (21): | 16.79 | |
| Williams %R (14): | -26.09 | |
| Chande Momentum Oscillator (20): | 0.12 | |
| Repulse (5,40,3): | 0.3100 | |
| ROCnROLL: | -1 | |
| TRIX (15,9): | -0.0100 | |
| Courbe Coppock: | 0.44 |
| MA7: | 16.76 | |
| MA20: | 17.13 | |
| MA50: | 17.42 | |
| MA100: | 18.27 | |
| MAexp7: | 16.76 | |
| MAexp20: | 16.71 | |
| MAexp50: | 16.78 | |
| MAexp100: | 16.94 | |
| Price / MA7: | +0.24% | |
| Price / MA20: | -1.93% | |
| Price / MA50: | -3.56% | |
| Price / MA100: | -8.05% | |
| Price / MAexp7: | +0.24% | |
| Price / MAexp20: | +0.54% | |
| Price / MAexp50: | +0.12% | |
| Price / MAexp100: | -0.83% |
News
The last news published on QUADIENT at the time of the generation of this analysis was as follows:
- Quadient positioned as the Leader in the 2024 SPARK Matrix™ for Accounts Payable Automation by QKS Group
- E-invoicing mandate for businesses in France: Quadient officially registered as a Dematerialization Platform Partner
- Quadient Unveils New Mobile App, Enabling Any Local Business to Offer Parcel Locker Delivery Services to Customers
- Quadient Secures Major Contract in North America, Demonstrating Strength in Integrating Digital Communications and Mail Automation Solutions
- More than 1.5 Million Higher Education Students in the U.S. Now Rely on Quadient Smart Lockers for Package Delivery
About author
Online


Add a comment
Comments
0 comments on the analysis QUADIENT - 1H