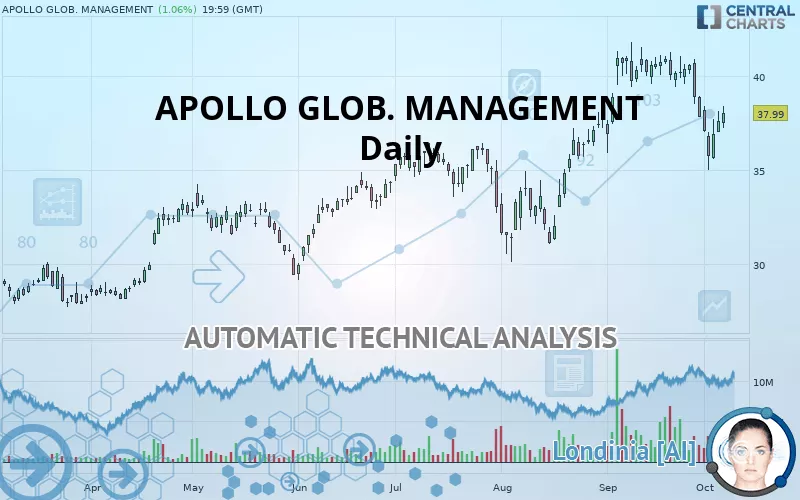
APOLLO GLOB. MANAGEMENT - Daily - Technical analysis published on 10/08/2019 (GMT)
- 362
- 0
- Who voted?
Click here for a new analysis!
- Timeframe : Daily
- - Analysis generated on
- Status : TARGET REACHED

Summary of the analysis

Additional analysis
Quotes
APOLLO GLOB. MANAGEMENT rating 37.99 USD. On the day, this instrument gained +1.06% with the lowest point at 37.21 USD and the highest point at 38.36 USD. The deviation from the price is +2.10% for the low point and -0.96% for the high point.The Central Gaps scanner detects a bearish opening marking the presence of sellers ahead of buyers at the opening but not sufficiently marked to allow the price to register a quotation gap.
Bearish opening
Type : Bearish
Timeframe : Openning
So that you have an overall view of the price change, here is a table showing the variations over several periods:
Abnormal volumes
Timeframe : 20 days
Abnormal volumes
Timeframe : 50 days
Technical
A technical analysis in Daily of this APOLLO GLOB. MANAGEMENT chart shows a bullish trend. 71.43% of the signals given by moving averages are bullish. Caution: the neutral signals currently given by the short-term moving averages indicate that this bullish trend is showing signs of running out of steam. The Central Indicators market scanner is currently detecting a bullish signal that could impact this trend:
Bullish trend reversal : adaptative moving average 50
Type : Bullish
Timeframe : Daily
An assessment of technical indicators does not currently provide any relevant information to suggest whether the signal given by the technical indicators is more bullish or bearish.
But beware of excesses. The Central Indicators scanner currently detects this:
CCI indicator is oversold : under -100
Type : Neutral
Timeframe : Daily
MACD indicator is back under 0
Type : Bearish
Timeframe : Daily
Price is back over the pivot point
Type : Bullish
Timeframe : Daily
No signals are given by Central Patterns, a market scanner specialised in chart patterns, resistances and supports.
The Central Candlesticks scanner which studies Japanese candlesticks did not detect anything.
| S3 | S2 | S1 | Price | R1 | |
|---|---|---|---|---|---|
| ProTrendLines | 31.11 | 33.32 | 36.24 | 37.99 | 40.55 |
| Change (%) | -18.11% | -12.29% | -4.61% | - | +6.74% |
| Change | -6.88 | -4.67 | -1.75 | - | +2.56 |
| Level | Minor | Intermediate | Major | - | Intermediate |
To determine price objectives, it is also possible to use the pivot points. Here is the price position in relation to pivot points:
| Pivot points | S3 | S2 | S1 | PP | R1 | R2 | R3 |
|---|---|---|---|---|---|---|---|
| Standard | 35.87 | 36.42 | 37.01 | 37.56 | 38.15 | 38.71 | 39.29 |
| Camarilla | 37.28 | 37.38 | 37.49 | 37.59 | 37.70 | 37.80 | 37.90 |
| Woodie | 35.88 | 36.43 | 37.02 | 37.57 | 38.16 | 38.71 | 39.30 |
| Fibonacci | 36.42 | 36.86 | 37.13 | 37.56 | 38.00 | 38.27 | 38.71 |
| Pivot points | S3 | S2 | S1 | PP | R1 | R2 | R3 |
|---|---|---|---|---|---|---|---|
| Standard | 31.47 | 33.24 | 35.41 | 37.18 | 39.35 | 41.12 | 43.29 |
| Camarilla | 36.51 | 36.87 | 37.23 | 37.59 | 37.95 | 38.31 | 38.67 |
| Woodie | 31.68 | 33.34 | 35.62 | 37.28 | 39.56 | 41.22 | 43.50 |
| Fibonacci | 33.24 | 34.74 | 35.67 | 37.18 | 38.68 | 39.61 | 41.12 |
| Pivot points | S3 | S2 | S1 | PP | R1 | R2 | R3 |
|---|---|---|---|---|---|---|---|
| Standard | 29.34 | 32.63 | 35.22 | 38.51 | 41.10 | 44.39 | 46.98 |
| Camarilla | 36.20 | 36.74 | 37.28 | 37.82 | 38.36 | 38.90 | 39.44 |
| Woodie | 29.00 | 32.46 | 34.88 | 38.34 | 40.76 | 44.22 | 46.64 |
| Fibonacci | 32.63 | 34.87 | 36.26 | 38.51 | 40.75 | 42.14 | 44.39 |
Numerical data
The following are the details of the technical indicators and moving averages that were collected to generate this technical analysis:
| RSI (14): | 48.51 | |
| MACD (12,26,9): | -0.0500 | |
| Directional Movement: | -7.88 | |
| AROON (14): | -57.14 | |
| DEMA (21): | 38.69 | |
| Parabolic SAR (0,02-0,02-0,2): | 38.75 | |
| Elder Ray (13): | -0.51 | |
| Super Trend (3,10): | 39.97 | |
| Zig ZAG (10): | 37.99 | |
| VORTEX (21): | 0.8900 | |
| Stochastique (14,3,5): | 39.79 | |
| TEMA (21): | 37.71 | |
| Williams %R (14): | -52.16 | |
| Chande Momentum Oscillator (20): | -2.89 | |
| Repulse (5,40,3): | 1.1600 | |
| ROCnROLL: | -1 | |
| TRIX (15,9): | 0.2100 | |
| Courbe Coppock: | 13.67 |
| MA7: | 37.42 | |
| MA20: | 39.34 | |
| MA50: | 36.68 | |
| MA100: | 34.90 | |
| MAexp7: | 37.79 | |
| MAexp20: | 38.42 | |
| MAexp50: | 37.27 | |
| MAexp100: | 35.34 | |
| Price / MA7: | +1.52% | |
| Price / MA20: | -3.43% | |
| Price / MA50: | +3.57% | |
| Price / MA100: | +8.85% | |
| Price / MAexp7: | +0.53% | |
| Price / MAexp20: | -1.12% | |
| Price / MAexp50: | +1.93% | |
| Price / MAexp100: | +7.50% |
News
The latest news and videos published on APOLLO GLOB. MANAGEMENT at the time of the analysis were as follows:
- Intrado Digital Media Releases 2019 Benchmark Report for Webcasts and Virtual Events
- Customers Choose Flowroute as 2019 Top SIP Trunk Provider
- Intrado Digital Media Introduces Integrated Workflow Solution for Marketers
- Health Advocate Awarded Patents for Innovative Software Powering Integrated Health and Benefits Services
- Intrado Announces Second Annual Digital Media Client Summit
About author

Online


Add a comment
Comments
0 comments on the analysis APOLLO GLOB. MANAGEMENT - Daily